The USDCHF pair increases slightly on Monday and receives backing from a combination of elements.
…
This is a premium post.
[s2If !current_user_can(access_s2member_level4)]Please register for FREE REGISTER to read full post below containing analysis. In case of any error or you think you are not able to read the full post below, please email us at support#nehcap.com [lwa][/s2If] [s2If current_user_can(access_s2member_level1)]
- USD/CHF edges higher on Monday and draws support from a combination of factors.
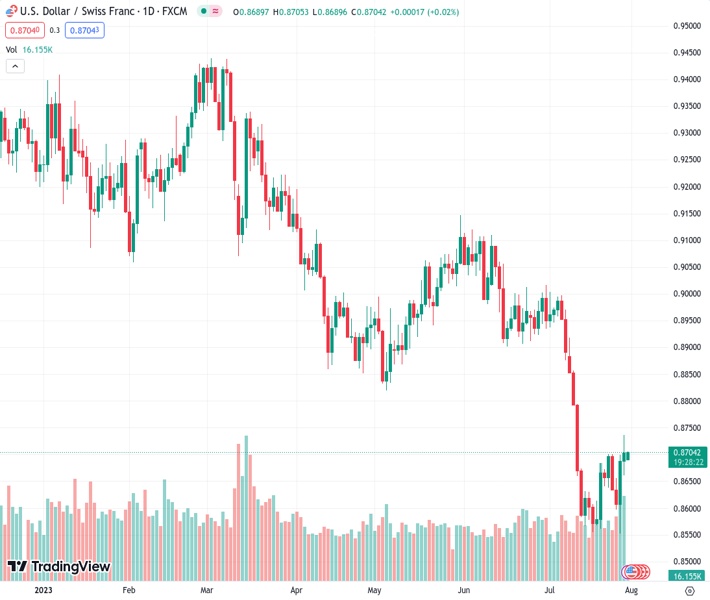
The pair currently trades last at 0.87005.
The previous day high was 0.8737 while the previous day low was 0.8661. The daily 38.2% Fib levels comes at 0.8708, expected to provide resistance. Similarly, the daily 61.8% fib level is at 0.869, expected to provide support.
The USD/CHF pair attracts some dip-buying near the 0.8675-0.8670 area on the first day of a new week and moves back closer to over a two-week high touched on Friday. Spot prices currently trade around the 0.8700 round-figure mark and look to build on last week’s goodish rebound from mid-0.8500s, or a fresh low since January 2015.
The prevalent risk-on environment – as depicted by a generally positive tone around the equity markets – is seen undermining the safe-haven Swiss Franc (CHF) and acting as a tailwind for the USD/CHF pair. The US Dollar (USD), on the other hand, holds steady just below a nearly three-week high and remains well supported by elevated US Treasury bond yields, bolstered by prospects for further policy tightening by the Federal Reserve (Fed).
It is worth recalling that Fed Chair Jerome Powell had said last week that the economy still needs to slow and the labour market to weaken for inflation to credibly return to the 2% target. Moroever, the US GDP report pointed to an extremely resilient economy and kept the door for one more 25 bps rate-hike in September or November wide open. This, to a larger extent, overshadows signs of receding underlying price pressures in the US.
In fact, the US Bureau of Economic Analysis reported that the PCE Price Index rose 0.2% last month and advanced 3.0% over the twelve months through June, registering its smallest gains since March 2021. Excluding the volatile food and energy components, the Core PCE Price Index came in at 4.1% YoY rate – the smallest increase since September 2021. This could force the Fed to end its fastest rate-hiking cycle since the 1980s and cap the USD.
The aforementioned fundamental backdrop, meanwhile, seems tilted in favour of the USD bulls and supports prospects for some meaningful near-term appreciating move for the USD/CHF pair. Traders, however, might refrain from placing aggressive bets and prefer to wait on the sidelines ahead of this week’s important US macro releases scheduled at the beginning of a new month, including the closely-watched NFP report on Friday.
Technical Levels: Supports and Resistances
USDCHF currently trading at 0.87 at the time of writing. Pair opened at 0.8703 and is trading with a change of -0.03 % .
| Overview | Overview.1 | |
|---|---|---|
| 0 | Today last price | 0.8700 |
| 1 | Today Daily Change | -0.0003 |
| 2 | Today Daily Change % | -0.0300 |
| 3 | Today daily open | 0.8703 |
The pair remains strongly bearish on the daily time frame. It trades below the 20 SMA @ 0.8736, 50 SMA 0.8902, 100 SMA @ 0.8968 and 200 SMA @ 0.9185.
| Trends | Trends.1 | |
|---|---|---|
| 0 | Daily SMA20 | 0.8736 |
| 1 | Daily SMA50 | 0.8902 |
| 2 | Daily SMA100 | 0.8968 |
| 3 | Daily SMA200 | 0.9185 |
The previous day high was 0.8737 while the previous day low was 0.8661. The daily 38.2% Fib levels comes at 0.8708, expected to provide resistance. Similarly, the daily 61.8% fib level is at 0.869, expected to provide support.
Note the levels of interest below:
- Pivot support is noted at 0.8664, 0.8625, 0.8588
- Pivot resistance is noted at 0.8739, 0.8776, 0.8815
| Levels | Levels.1 |
|---|---|
| Previous Daily High | 0.8737 |
| Previous Daily Low | 0.8661 |
| Previous Weekly High | 0.8737 |
| Previous Weekly Low | 0.8552 |
| Previous Monthly High | 0.9120 |
| Previous Monthly Low | 0.8902 |
| Daily Fibonacci 38.2% | 0.8708 |
| Daily Fibonacci 61.8% | 0.8690 |
| Daily Pivot Point S1 | 0.8664 |
| Daily Pivot Point S2 | 0.8625 |
| Daily Pivot Point S3 | 0.8588 |
| Daily Pivot Point R1 | 0.8739 |
| Daily Pivot Point R2 | 0.8776 |
| Daily Pivot Point R3 | 0.8815 |
[/s2If]
Download Nehcap EAWe have two EAs that are operational on our LIVE accounts.
- EA-FIX: Check out the details here. Download EA-FIX . EA-FIX is a non-grid HFT scalper.
- EA-GROWTH: High quality low dd EA using trend grids. Download EA_GROWTHJoin Our Telegram Group
")


