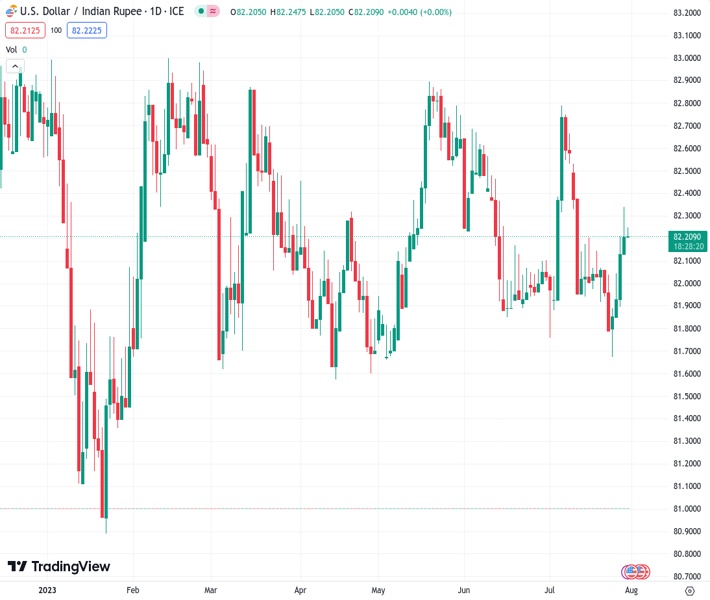
The USD to INR exchange rate, currently at 82.2200, is continuing to decline from its peak of the past two weeks. It is under pressure and approaching the lowest point reached today.
…
This is a premium post.
[s2If !current_user_can(access_s2member_level4)]Please register for FREE REGISTER to read full post below containing analysis. In case of any error or you think you are not able to read the full post below, please email us at support#nehcap.com [lwa][/s2If] [s2If current_user_can(access_s2member_level1)]
- USD/INR extends Friday’s pullback from two-week high, pressured near intraday low of late.
The pair currently trades last at 82.2200.
The previous day high was 82.3754 while the previous day low was 82.155. The daily 38.2% Fib levels comes at 82.2392, expected to provide resistance. Similarly, the daily 61.8% fib level is at 82.2912, expected to provide resistance.
USD/INR stays on the back foot around 82.20 as it prods short-term key support confluence amid early Monday in Asia. In doing so, the Indian Rupee (INR) pair drops for the second consecutive day amid mixed sentiment in the market ahead of the all-important US Nonfarm Payrolls (NFP), up for publishing on Friday.
That said, downbeat prints of the US inflation clues and the recently softer comments from the Fed officials weigh on the USD/INR prices amid cautious optimism in the Asia-Pacific zone.
Recently, China’s State Council announced multiple measures to conserve and boost consumer demand and favored the risk-on mood in Asia. Additionally, weekend comments from European Central Bank (ECB) and the Federal Reserve (Fed) officials suggest nearness to the policy pivot and offered reason to better prepare the US Dollar for this week’s employment report for July.
At home, Reuters shared a report from Geojit Financial Services mentioning that the aggregate net profit and revenue of these companies grew 32% and 7.88% from a year earlier, with profit growing at the fastest pace in eight quarters.
Further, the recent retreat of the WTI crude oil from a 14-week high, down 0.50% intraday near $80.10 by the press time, also allows the Indian Rupee (INR) to remain firmer due to the nation’s heavy reliance on the Oil imports.
It’s worth noting that the MSCI’s index of Asia-Pacific shares outside Japan remains firmer at the latest highest levels since early February whereas S&P500 Futures seesaw past 4,600, close the yearly top. Further, the US Dollar Index (DXY) struggles for clear directions around 101.70 after retreating from a three-week high the previous day, due to the softer prints of the Fed’s preferred inflation gauge, namely the US Core Personal Consumption Expenditure (PCE) Price Index for June.
Moving on, risk catalysts and a few more activity data from China may entertain USD/INR traders ahead of US ISM PMI and Nonfarm Payrolls (NFP) for July.
A convergence of the 100 and 21 DMA restricts the immediate downside of the USD/INR pair around 82.20 even if the recovery remains elusive below a three-week-old resistance line, close to 82.40 at the latest.
Technical Levels: Supports and Resistances
USDINR currently trading at 82.2278 at the time of writing. Pair opened at 82.2795 and is trading with a change of -0.06% % .
| Overview | Overview.1 | |
|---|---|---|
| 0 | Today last price | 82.2278 |
| 1 | Today Daily Change | -0.0517 |
| 2 | Today Daily Change % | -0.06% |
| 3 | Today daily open | 82.2795 |
The pair is trading above its 20 Daily moving average @ 82.1944, below its 50 Daily moving average @ 82.266 , above its 100 Daily moving average @ 82.1985 and above its 200 Daily moving average @ 82.1617
| Trends | Trends.1 | |
|---|---|---|
| 0 | Daily SMA20 | 82.1944 |
| 1 | Daily SMA50 | 82.2660 |
| 2 | Daily SMA100 | 82.1985 |
| 3 | Daily SMA200 | 82.1617 |
The previous day high was 82.3754 while the previous day low was 82.155. The daily 38.2% Fib levels comes at 82.2392, expected to provide resistance. Similarly, the daily 61.8% fib level is at 82.2912, expected to provide resistance.
Note the levels of interest below:
- Pivot support is noted at 82.1645, 82.0495, 81.9441
- Pivot resistance is noted at 82.385, 82.4904, 82.6054
| Levels | Levels.1 |
|---|---|
| Previous Daily High | 82.3754 |
| Previous Daily Low | 82.1550 |
| Previous Weekly High | 82.3860 |
| Previous Weekly Low | 81.6588 |
| Previous Monthly High | 82.7370 |
| Previous Monthly Low | 81.8477 |
| Daily Fibonacci 38.2% | 82.2392 |
| Daily Fibonacci 61.8% | 82.2912 |
| Daily Pivot Point S1 | 82.1645 |
| Daily Pivot Point S2 | 82.0495 |
| Daily Pivot Point S3 | 81.9441 |
| Daily Pivot Point R1 | 82.3850 |
| Daily Pivot Point R2 | 82.4904 |
| Daily Pivot Point R3 | 82.6054 |
[/s2If]
Download Nehcap EAWe have two EAs that are operational on our LIVE accounts.
- EA-FIX: Check out the details here. Download EA-FIX . EA-FIX is a non-grid HFT scalper.
- EA-GROWTH: High quality low dd EA using trend grids. Download EA_GROWTHJoin Our Telegram Group
")


