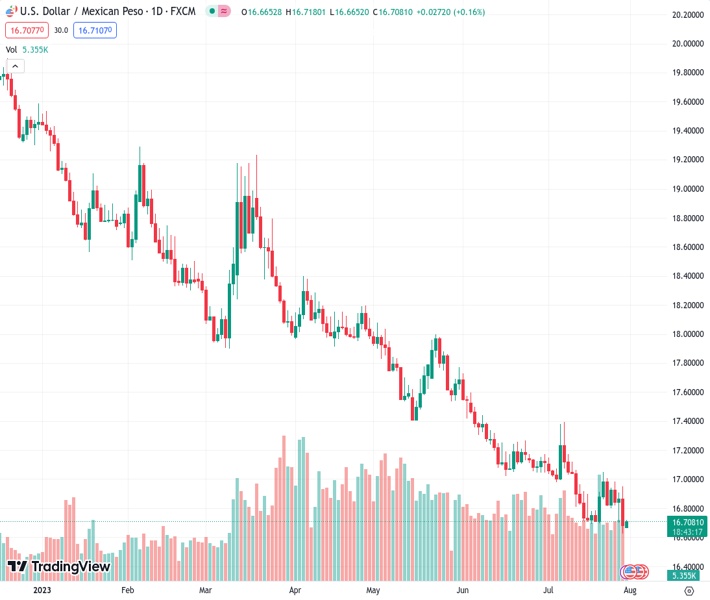
The US dollar to Mexican peso exchange rate, currently at 16.7074, rebounds from its lowest point since December 2015 and reduces its largest daily decline in two months. @nehcap predicts a small recovery, with limited gains anticipated.
…
This is a premium post.
[s2If !current_user_can(access_s2member_level4)]Please register for FREE REGISTER to read full post below containing analysis. In case of any error or you think you are not able to read the full post below, please email us at support#nehcap.com [lwa][/s2If] [s2If current_user_can(access_s2member_level1)]
- USD/MXN bounces off the lowest level since December 2015, pares the biggest daily loss in two months.
The pair currently trades last at 16.7074.
The previous day high was 16.9488 while the previous day low was 16.6258. The daily 38.2% Fib levels comes at 16.7492, expected to provide resistance. Similarly, the daily 61.8% fib level is at 16.8254, expected to provide resistance.
USD/MXN picks up bids to consolidate the biggest daily loss in two months around 16.72, up 0.17% intraday, amid early Monday. In doing so, the Mexican Peso (MXN) pair recovers from its lowest level since December 2015.
That said, the below 50 levels of the RSI (14) line supports the USD/MXN pair’s corrective bounce off the two-week-old horizontal line, around 16.70. However, the impending bear cross on the MACD challenges the buyers.
It’s worth noting that a downward-sloping resistance line from July 07, close to 16.83 by the press time, restricts the immediate recovery of the USD/MXN pair.
Following that, the 21-DMA level of around 16.90 becomes crucial for the USD/MXN bulls to cross to retake control.
Also acting as an upside filter is the previous support line stretched from mid-June, close to 16.97 at the latest, quickly followed by the 17.00 round figure.
Meanwhile, a daily closing beneath the previously stated horizontal support near 16.70 can direct the USD/MXN bears toward a downward-sloping support line from mid-May, around 16.55 by the press time.
In a case where the USD/MXN remains bearish past 16.55, the October 2015 low of near 16.32 will be in the spotlight.
Trend: Limited recovery expected
Technical Levels: Supports and Resistances
USDMXN currently trading at 16.71 at the time of writing. Pair opened at 16.69 and is trading with a change of 0.12% % .
| Overview | Overview.1 | |
|---|---|---|
| 0 | Today last price | 16.71 |
| 1 | Today Daily Change | 0.0200 |
| 2 | Today Daily Change % | 0.12% |
| 3 | Today daily open | 16.69 |
The pair remains strongly bearish on the daily time frame. It trades below the 20 SMA @ 16.9166, 50 SMA 17.1913, 100 SMA @ 17.6504 and 200 SMA @ 18.3868.
| Trends | Trends.1 | |
|---|---|---|
| 0 | Daily SMA20 | 16.9166 |
| 1 | Daily SMA50 | 17.1913 |
| 2 | Daily SMA100 | 17.6504 |
| 3 | Daily SMA200 | 18.3868 |
The previous day high was 16.9488 while the previous day low was 16.6258. The daily 38.2% Fib levels comes at 16.7492, expected to provide resistance. Similarly, the daily 61.8% fib level is at 16.8254, expected to provide resistance.
Note the levels of interest below:
- Pivot support is noted at 16.561, 16.4319, 16.238
- Pivot resistance is noted at 16.8839, 17.0778, 17.2069
| Levels | Levels.1 |
|---|---|
| Previous Daily High | 16.9488 |
| Previous Daily Low | 16.6258 |
| Previous Weekly High | 17.0097 |
| Previous Weekly Low | 16.6258 |
| Previous Monthly High | 17.7286 |
| Previous Monthly Low | 17.0243 |
| Daily Fibonacci 38.2% | 16.7492 |
| Daily Fibonacci 61.8% | 16.8254 |
| Daily Pivot Point S1 | 16.5610 |
| Daily Pivot Point S2 | 16.4319 |
| Daily Pivot Point S3 | 16.2380 |
| Daily Pivot Point R1 | 16.8839 |
| Daily Pivot Point R2 | 17.0778 |
| Daily Pivot Point R3 | 17.2069 |
[/s2If]
Download Nehcap EAWe have two EAs that are operational on our LIVE accounts.
- EA-FIX: Check out the details here. Download EA-FIX . EA-FIX is a non-grid HFT scalper.
- EA-GROWTH: High quality low dd EA using trend grids. Download EA_GROWTHJoin Our Telegram Group
")


