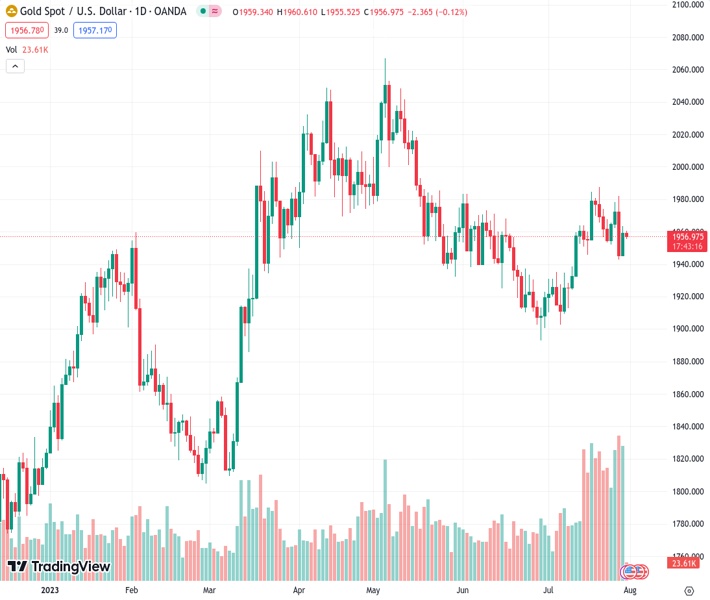
The price of gold, represented by #XAUUSD at 1,956.82, decreases slightly on the initial day of the week, reducing some of the gains it achieved on Friday.
…
This is a premium post.
[s2If !current_user_can(access_s2member_level4)]Please register for FREE REGISTER to read full post below containing analysis. In case of any error or you think you are not able to read the full post below, please email us at support#nehcap.com [lwa][/s2If] [s2If current_user_can(access_s2member_level1)]
- Gold price edges lower on the first day of a new week and erodes a part of Friday’s positive move.
The pair currently trades last at 1956.82.
The previous day high was 1963.56 while the previous day low was 1945.5. The daily 38.2% Fib levels comes at 1956.66, expected to provide support. Similarly, the daily 61.8% fib level is at 1952.4, expected to provide support.
Gold price struggles to capitalize on Friday’s rebound from the vicinity of over a two-week low and kicks off the new week on a softer note. The XAU/USD remains on the defensive through the Asian session and currently trades just above the $1,955 level, down over 0.15% for the day.
The upbeat US GDP report released last Thursday pointed to an extremely resilient economy and kept the door open for one more 25 bps rate-hike by the Federal Reserve (Fed) in September or November. It is worth recalling that Fed Chair Jerome Powell had said last week that the economy still needs to slow and the labour market to weaken for inflation to credibly return to the 2% target. This, in turn, remains supportive of elevated US Treasury bond yields, which, to a larger extent, helps offset signs of colling inflationary pressures in the US and assists the US Dollar (USD) to hold steady below a nearly three-week high touched on Friday. A stronger Greenback tends to weigh on US Dollar-denominated commodities, which, along with a more hawkish stance adopted by other major central banks exerts some pressure on the Gold price.
In fact, the European Central Bank (ECB) noted that inflation, though continues to decline, is still expected to remain too high for too long and backed the case for further policy tightening. Moreover, the Bank of England (BoE) is expected to raise its benchmark interest rate by 25 bps on August 3, to 5.25%, or the highest since early 2008. The markets have also been pricing in two more BoE rate hikes by the end of this year as price pressures persist. Furthermore, the Bank of Japan (BoJ) started the proscess of moving away from decades of massive monetary stimulus and made its Yield Curve Control (YCC) policy flexible on Friday. This suggests that the path of least resistance for the Gold price is to the downside, though speculations that the Fed is nearing the end of its fastest interest rate hiking cycle since the 1980s might help limit losses.
The US Bureau of Economic Analysis reported that the Personal Consumption Expenditures (PCE) Price Index advanced 0.2% in June and rose 3.0% over the twelve months, registering its smallest gains since March 2021. Adding to this, the Core PCE Price Index (excluding the volatile food and energy components) came in at 4.1% YoY rate – the smallest increase since September 2021. This comes on the back of the US CPI report earlier this month and further points to signs of easing inflationary pressures. This should allow the Fed to soften its hawkish stance and supports prospecs for the emregence of some dip-buying around the Gold price, warranting some caution before placing fresh bearish bets around the Gold price.
Technical Levels: Supports and Resistances
XAUUSD currently trading at 1956.77 at the time of writing. Pair opened at 1959.5 and is trading with a change of -0.14 % .
| Overview | Overview.1 | |
|---|---|---|
| 0 | Today last price | 1956.77 |
| 1 | Today Daily Change | -2.73 |
| 2 | Today Daily Change % | -0.14 |
| 3 | Today daily open | 1959.50 |
The pair is trading above its 20 Daily moving average @ 1948.39, above its 50 Daily moving average @ 1946.6 , below its 100 Daily moving average @ 1967.14 and above its 200 Daily moving average @ 1887.74
| Trends | Trends.1 | |
|---|---|---|
| 0 | Daily SMA20 | 1948.39 |
| 1 | Daily SMA50 | 1946.60 |
| 2 | Daily SMA100 | 1967.14 |
| 3 | Daily SMA200 | 1887.74 |
The previous day high was 1963.56 while the previous day low was 1945.5. The daily 38.2% Fib levels comes at 1956.66, expected to provide support. Similarly, the daily 61.8% fib level is at 1952.4, expected to provide support.
Note the levels of interest below:
- Pivot support is noted at 1948.81, 1938.13, 1930.75
- Pivot resistance is noted at 1966.87, 1974.25, 1984.93
| Levels | Levels.1 |
|---|---|
| Previous Daily High | 1963.56 |
| Previous Daily Low | 1945.50 |
| Previous Weekly High | 1982.20 |
| Previous Weekly Low | 1942.65 |
| Previous Monthly High | 1983.50 |
| Previous Monthly Low | 1893.01 |
| Daily Fibonacci 38.2% | 1956.66 |
| Daily Fibonacci 61.8% | 1952.40 |
| Daily Pivot Point S1 | 1948.81 |
| Daily Pivot Point S2 | 1938.13 |
| Daily Pivot Point S3 | 1930.75 |
| Daily Pivot Point R1 | 1966.87 |
| Daily Pivot Point R2 | 1974.25 |
| Daily Pivot Point R3 | 1984.93 |
[/s2If]
Download Nehcap EAWe have two EAs that are operational on our LIVE accounts.
- EA-FIX: Check out the details here. Download EA-FIX . EA-FIX is a non-grid HFT scalper.
- EA-GROWTH: High quality low dd EA using trend grids. Download EA_GROWTHJoin Our Telegram Group
")


