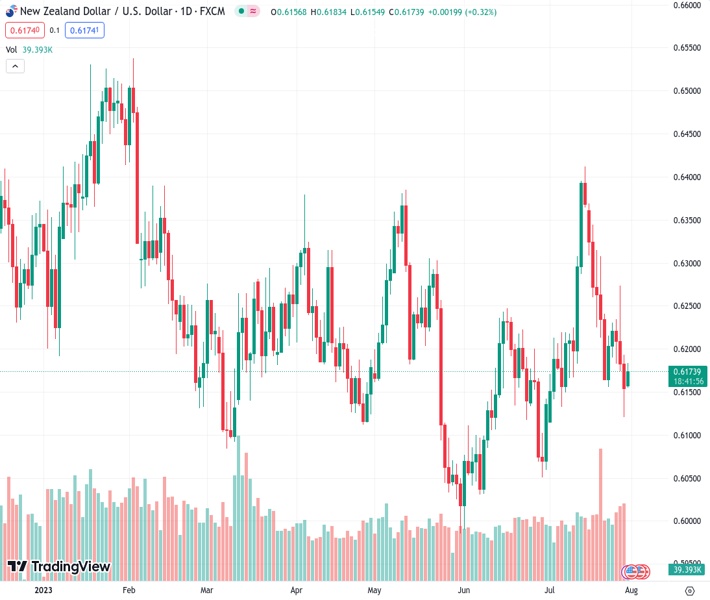
The NZDUSD pair experiences a significant increase above the 0.6170 level after the release of the Chinese PMI data.
…
This is a premium post.
[s2If !current_user_can(access_s2member_level4)]Please register for FREE REGISTER to read full post below containing analysis. In case of any error or you think you are not able to read the full post below, please email us at support#nehcap.com [lwa][/s2If] [s2If current_user_can(access_s2member_level1)]
- The pair currently trades last at 0.61762.
- Pivot support is noted at 0.6115, 0.608, 0.604
- Pivot resistance is noted at 0.619, 0.623, 0.6265
- EA-FIX: Check out the details here. Download EA-FIX . EA-FIX is a non-grid HFT scalper.
- EA-GROWTH: High quality low dd EA using trend grids. Download EA_GROWTHJoin Our Telegram Group
The previous day high was 0.6195 while the previous day low was 0.612. The daily 38.2% Fib levels comes at 0.6149, expected to provide support. Similarly, the daily 61.8% fib level is at 0.6166, expected to provide support.
The NZD/USD pair gains momentum and edges higher to 0.6175 during the early Asian session on Monday. The uptick in the Kiwi comes after the release of the Chinese NBS Manufacturing and Non-Manufacturing Purchasing Managers Index (PMI).
The latest publication released by The National Bank of New Zealand showed on Monday that July’s New Zealand ANZ Activity Outlook improved to 0.8%, above the expected 0.9% decline. Meanwhile, ANZ Business Confidence fell from -18 in June to -13.1 in July.
Regarding the Chinese data, China’s National Bureau of Statistics (NBS) revealed on Monday that the Manufacturing Purchasing Managers’ Index (PMI) increased to 49.3 in July, improving from 49.0 in June and the market’s estimate of 49.2. However, the figure was marked below 50 for the fourth straight month, indicating the contraction zone. Meanwhile, the NBS Services PMI fell from 53.2 in June to 51.5 in July.
Investors anticipate additional policy support to spur economic recovery post-Covid. The State Council Information Office of China revealed that Li Chunlin, vice chairman of the National Development and Reform Commission, and officials from the Ministry of Industry and Information Technology, the Ministry of Commerce, and the State Administration of Market Regulation will hold a press conference at 7 a.m. GMT to announce additional measures to boost consumption. The development of the headline might boost the China-proxy Kiwi.
The annual US inflation figure grew at its slowest pace in over two years. The US Bureau of Economic Analysis reported on Friday that the Personal Consumption Expenditures (PCE) Price Index fell from 3.8% in May to 3% in June, below the market expectation of 3.1%. While the Federal Reserve’s preferred measure of inflation, the Core PCE Price Index, came in at 4.1% annually, down from 4.6% in May and below market expectations of 4.2%. The softer data indicates pricing pressures are easing and may bring the Federal Reserve (Fed) closer to the end of its hiking cycle. This, in turn, might cap the upside in the US Dollar and act as a tailwind for NZD/USD.
Looking ahead, the New Zealand Employment Change QoQ and Unemployment Rate Q2 will be released on Wednesday. The week’s highlight will be the Nonfarm Payrolls report, due on Friday. The economy is expected to have created 180,000 jobs, with the unemployment rate remaining at 3.6%. These events could significantly impact the US Dollar’s dynamic and give the NZD/USD pair a clear direction.
Technical Levels: Supports and Resistances
NZDUSD currently trading at 0.6172 at the time of writing. Pair opened at 0.615 and is trading with a change of 0.36 % .
| Overview | Overview.1 | |
|---|---|---|
| 0 | Today last price | 0.6172 |
| 1 | Today Daily Change | 0.0022 |
| 2 | Today Daily Change % | 0.3600 |
| 3 | Today daily open | 0.6150 |
The pair is trading below its 20 Daily moving average @ 0.6229, above its 50 Daily moving average @ 0.6168 , below its 100 Daily moving average @ 0.6198 and below its 200 Daily moving average @ 0.6219
| Trends | Trends.1 | |
|---|---|---|
| 0 | Daily SMA20 | 0.6229 |
| 1 | Daily SMA50 | 0.6168 |
| 2 | Daily SMA100 | 0.6198 |
| 3 | Daily SMA200 | 0.6219 |
The previous day high was 0.6195 while the previous day low was 0.612. The daily 38.2% Fib levels comes at 0.6149, expected to provide support. Similarly, the daily 61.8% fib level is at 0.6166, expected to provide support.
Note the levels of interest below:
| Levels | Levels.1 |
|---|---|
| Previous Daily High | 0.6195 |
| Previous Daily Low | 0.6120 |
| Previous Weekly High | 0.6274 |
| Previous Weekly Low | 0.6120 |
| Previous Monthly High | 0.6250 |
| Previous Monthly Low | 0.5990 |
| Daily Fibonacci 38.2% | 0.6149 |
| Daily Fibonacci 61.8% | 0.6166 |
| Daily Pivot Point S1 | 0.6115 |
| Daily Pivot Point S2 | 0.6080 |
| Daily Pivot Point S3 | 0.6040 |
| Daily Pivot Point R1 | 0.6190 |
| Daily Pivot Point R2 | 0.6230 |
| Daily Pivot Point R3 | 0.6265 |
[/s2If]
Download Nehcap EAWe have two EAs that are operational on our LIVE accounts.
")


