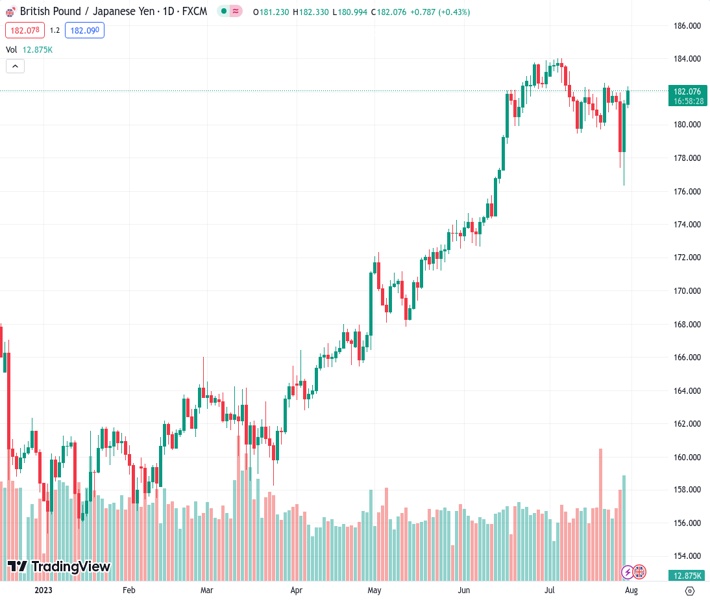
The GBPJPY pair, currently trading at 182.117, is experiencing a positive movement for the second consecutive day and reaching its highest level in one week.
…
This is a premium post.
[s2If !current_user_can(access_s2member_level4)]Please register for FREE REGISTER to read full post below containing analysis. In case of any error or you think you are not able to read the full post below, please email us at support#nehcap.com [lwa][/s2If] [s2If current_user_can(access_s2member_level1)]
- GBP/JPY gains positive traction for the second straight day and climbs to a one-week high.
The pair currently trades last at 182.117.
The previous day high was 181.5 while the previous day low was 176.32. The daily 38.2% Fib levels comes at 179.52, expected to provide support. Similarly, the daily 61.8% fib level is at 178.3, expected to provide support.
The GBP/JPY cross builds on Friday’s strong intraday recovery of over 500 pips from the 176.30 area, or its lowest level since June 13 and scales higher for the second successive day on Monday. The momentum lifts spot prices to a one-week top, near the 182.20 area during the Asian session and is sponsored by the emergence of fresh selling around the Japanese Yen (JPY).
As investors look past the Bank of Japan’s (BoJ) move to make its Yield Curve Control (YCC) policy flexible, the prevalent risk-on mood undermines the safe-haven Japanese Yen (JPY) and acts as a tailwind for the GBP/JPY cross. It is worth recalling that the BoJ said on Friday that the 0.5% cap on the 10-year Japanese government bond yield will now be “references” rather than “rigid limits” and that it would step in the markets at a yield of 1.0%. This was seen as a step towards a possible shift away from the BoJ’s dovish stance, though the immedaite market reaction turned out to be short-lived as market participants seem convinced that the central bank will stick to its loose monetary policy settings.
In contrast, the Bank of England (BoE) is expected to raise its benchmark interest rate by 25 bps on August 3, to 5.25%, or the highest since early 2008. Moreover, the markets have been pricing in two more BoE rate hikes by the end of this year as price pressures persist. This contributes to the British Pound’s relative outperformance against its Japanese counterpart and turns out to be another factor providing an additional boost to the GBP/JPY cross. That said, the UK consumer inflation figures released earlier this month forced investors to scale back their expectations for more aggressive policy tightening by the BoE. This might hold back bulls from placing fresh bets around the GBP and cap gains.
Hence, traders are more likely to move to the sidelines ahead of the highly-anticipated BoE monetary policy meeting scheduled this week, on Thursday. The outcome will play a key role in influencing the Sterling and help investors to determine the next leg of a directional move. In the meantime, the aforementioned fundamental backdrop makes it prudent to wait for some follow-through buying beyond the 182.50 supply zone before positioning for any further appreciating move in the absence of any relevant market moving economic data from the UK.
Technical Levels: Supports and Resistances
GBPJPY currently trading at 182.15 at the time of writing. Pair opened at 181.42 and is trading with a change of 0.4 % .
| Overview | Overview.1 | |
|---|---|---|
| 0 | Today last price | 182.15 |
| 1 | Today Daily Change | 0.73 |
| 2 | Today Daily Change % | 0.40 |
| 3 | Today daily open | 181.42 |
The pair remains strongly bullish on the daily timeframe. It trades above its 20 SMA @ 181.68, 50 SMA 178.99, 100 SMA @ 172.57 and 200 SMA @ 167.93.
| Trends | Trends.1 | |
|---|---|---|
| 0 | Daily SMA20 | 181.68 |
| 1 | Daily SMA50 | 178.99 |
| 2 | Daily SMA100 | 172.57 |
| 3 | Daily SMA200 | 167.93 |
The previous day high was 181.5 while the previous day low was 176.32. The daily 38.2% Fib levels comes at 179.52, expected to provide support. Similarly, the daily 61.8% fib level is at 178.3, expected to provide support.
Note the levels of interest below:
- Pivot support is noted at 178.0, 174.57, 172.82
- Pivot resistance is noted at 183.17, 184.92, 188.35
| Levels | Levels.1 |
|---|---|
| Previous Daily High | 181.50 |
| Previous Daily Low | 176.32 |
| Previous Weekly High | 182.35 |
| Previous Weekly Low | 176.32 |
| Previous Monthly High | 183.88 |
| Previous Monthly Low | 172.67 |
| Daily Fibonacci 38.2% | 179.52 |
| Daily Fibonacci 61.8% | 178.30 |
| Daily Pivot Point S1 | 178.00 |
| Daily Pivot Point S2 | 174.57 |
| Daily Pivot Point S3 | 172.82 |
| Daily Pivot Point R1 | 183.17 |
| Daily Pivot Point R2 | 184.92 |
| Daily Pivot Point R3 | 188.35 |
[/s2If]
Download Nehcap EAWe have two EAs that are operational on our LIVE accounts.
- EA-FIX: Check out the details here. Download EA-FIX . EA-FIX is a non-grid HFT scalper.
- EA-GROWTH: High quality low dd EA using trend grids. Download EA_GROWTHJoin Our Telegram Group
")


