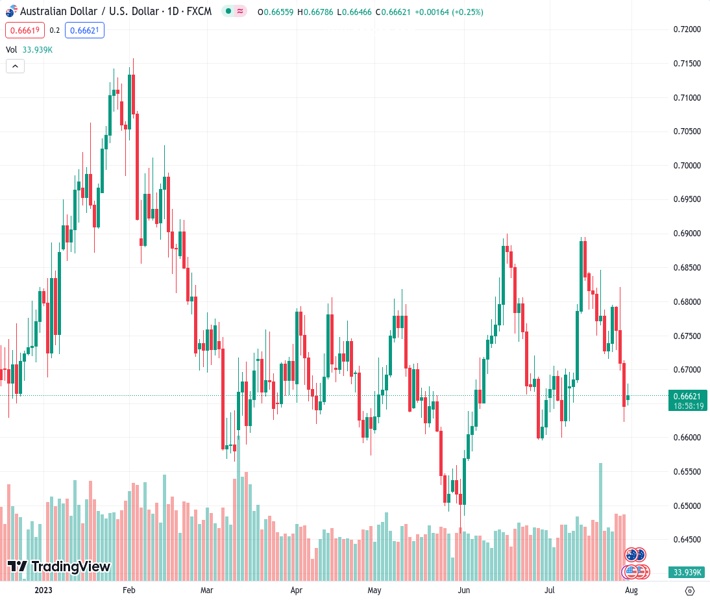
Demand for the AUDUSD currency pair at a rate of 0.66644 has increased, allowing it to continue its recovery from a low point reached earlier in the week.
…
This is a premium post.
[s2If !current_user_can(access_s2member_level4)]Please register for FREE REGISTER to read full post below containing analysis. In case of any error or you think you are not able to read the full post below, please email us at support#nehcap.com [lwa][/s2If] [s2If current_user_can(access_s2member_level1)]
- AUD/USD picks up bids to extend week-start rebound from three-week low.
The pair currently trades last at 0.66644.
The previous day high was 0.6714 while the previous day low was 0.6623. The daily 38.2% Fib levels comes at 0.6657, expected to provide support. Similarly, the daily 61.8% fib level is at 0.6679, expected to provide resistance.
AUD/USD prints the first daily gains in four as it recovers from the lowest levels in three weeks while printing mild gains around 0.6670 during the mid-Asian session on Monday. In doing so, the Aussie pair justifies the market’s slightly positive sentiment and the US Dollar’s retreat while taking positive clues from China’s official activity data and Australian inflation clues.
That said, China’s official NBS Manufacturing PMI edges higher to 49.3 versus 49.2 expected and 49.0 prior but the Non-Manufacturing PMI eases to 51.5 from 53.2 prior.
Further, Australia’s TD Securities Inflation rises to 0.8% MoM for July versus 0.1% previous readings while the yearly figures drop to 5.4% YoY from 5.7% marked in June. Elsewhere, Australia’s Private Sector Credit softens to 0.2% and 5.5% per the MoM and YoY basis in June compared to 0.4% and 6.2% respective priors.
Elsewhere, hopes of witnessing China’s further stimulus to boost demand, per Bloomberg’s news, put a floor under the AUD/USD prices.
Adding strength to the corrective bounce can be the comments from Federal Reserve Bank of Minneapolis President Neel Kashkari suggesting challenges for the US employment sector amid firmer rates. Also weighing on the US Dollar can be Friday’s downbeat inflation clues.
With this, the US Dollar Index (DXY) remains directionless around 101.70 after reversing from a three-week high the previous day on downbeat prints of the Core Personal Consumption Expenditure (PCE) Price Index, mostly known as the Fed’s preferred inflation gauge. It should be noted that the downbeat prints of US Personal Income and softer revision of the US Michigan Consumer Sentiment Index for July, as well as the University of Michigan’s (UoM) 5-year Consumer Inflation Expectations, also triggered the DXY pullback the previous day.
Against this backdrop, Wall Street closed positive and the yields retreated the previous day, slightly firmer by the press time. That said, the S&P500 Futures print mild gains by the press time.
Looking ahead, the US ISM PMIs and the risk catalysts can entertain the AUD/USD traders ahead of Friday’s US jobs report for July will be crucial to watch for clear directions.
Unless providing a daily closing beyond the 0.6690 support-turned-resistance confluence comprising the 100-DMA and a two-month-old rising trend line, AUD/USD bears stay hopeful of witnessing further downside towards testing the late June swing low of near 0.6600.
Technical Levels: Supports and Resistances
AUDUSD currently trading at 0.6665 at the time of writing. Pair opened at 0.665 and is trading with a change of 0.23% % .
| Overview | Overview.1 | |
|---|---|---|
| 0 | Today last price | 0.6665 |
| 1 | Today Daily Change | 0.0015 |
| 2 | Today Daily Change % | 0.23% |
| 3 | Today daily open | 0.665 |
The pair remains strongly bearish on the daily time frame. It trades below the 20 SMA @ 0.6738, 50 SMA 0.6698, 100 SMA @ 0.6693 and 200 SMA @ 0.6729.
| Trends | Trends.1 | |
|---|---|---|
| 0 | Daily SMA20 | 0.6738 |
| 1 | Daily SMA50 | 0.6698 |
| 2 | Daily SMA100 | 0.6693 |
| 3 | Daily SMA200 | 0.6729 |
The previous day high was 0.6714 while the previous day low was 0.6623. The daily 38.2% Fib levels comes at 0.6657, expected to provide support. Similarly, the daily 61.8% fib level is at 0.6679, expected to provide resistance.
Note the levels of interest below:
- Pivot support is noted at 0.661, 0.6571, 0.6519
- Pivot resistance is noted at 0.6701, 0.6753, 0.6792
| Levels | Levels.1 |
|---|---|
| Previous Daily High | 0.6714 |
| Previous Daily Low | 0.6623 |
| Previous Weekly High | 0.6821 |
| Previous Weekly Low | 0.6623 |
| Previous Monthly High | 0.6900 |
| Previous Monthly Low | 0.6484 |
| Daily Fibonacci 38.2% | 0.6657 |
| Daily Fibonacci 61.8% | 0.6679 |
| Daily Pivot Point S1 | 0.6610 |
| Daily Pivot Point S2 | 0.6571 |
| Daily Pivot Point S3 | 0.6519 |
| Daily Pivot Point R1 | 0.6701 |
| Daily Pivot Point R2 | 0.6753 |
| Daily Pivot Point R3 | 0.6792 |
[/s2If]
Download Nehcap EAWe have two EAs that are operational on our LIVE accounts.
- EA-FIX: Check out the details here. Download EA-FIX . EA-FIX is a non-grid HFT scalper.
- EA-GROWTH: High quality low dd EA using trend grids. Download EA_GROWTHJoin Our Telegram Group
")


