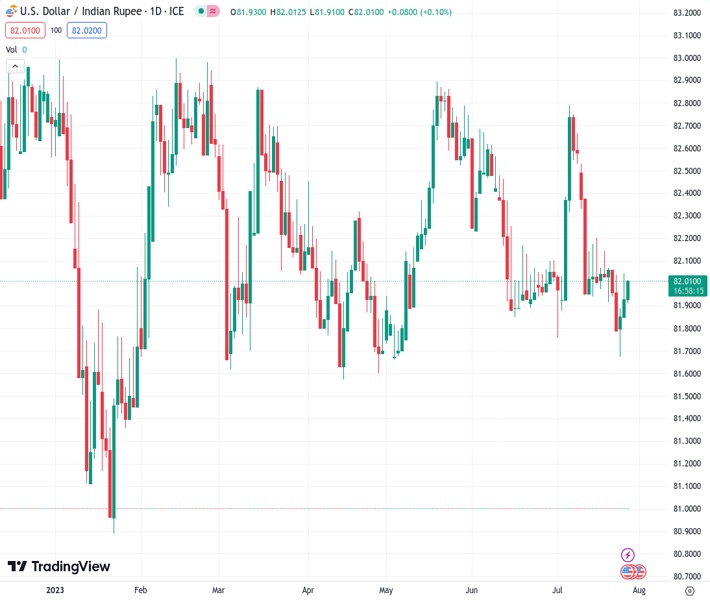
USDINR traded at 82.0050 and experienced a slight decline on Thursday, halting its two-day upward movement after reaching a low point that had lasted for several months.
…
This is a premium post.
[s2If !current_user_can(access_s2member_level4)]Please register for FREE REGISTER to read full post below containing analysis. In case of any error or you think you are not able to read the full post below, please email us at support#nehcap.com [lwa][/s2If] [s2If current_user_can(access_s2member_level1)]
- USD/INR edges lower on Thursday and stalls a two-day recovery trend from a multi-month low.
The pair currently trades last at 82.0050.
The previous day high was 82.122 while the previous day low was 81.8554. The daily 38.2% Fib levels comes at 82.0202, expected to provide resistance. Similarly, the daily 61.8% fib level is at 81.9573, expected to provide support.
The USD/INR pair struggles to capitalize on its recovery gains registered over the past two days, from the 81.65 region, or the lowest level since early May and attracts some sellers during the Asian session on Thursday. Spot prices, however, manage to recover a few pips from the daily low and currently trade around the 82.00 mark, down less than 0.10% for the day.
From a technical perspective, the recent breakdown through ascending trend-line support extending from November 2022, which coincided with the very important 200-day Simple Moving Average (SMA), favours bearish traders. Moreover, oscillators on the daily chart have just started gaining negative traction and add credence to the outlook. This, along with the prevalent US Dollar (USD) selling bias, suggests that the path of least resistance for the USD/INR pair is to the downside.
Hence, a slide back towards testing a multi-month low, around the 81.65 area touched on Tuesday, looks like a distinct possibility. The USD/INR could slide further towards the next relevant support near the 81.50 zone. Spot prices could eventually drop to test sub-81.00 levels or the YTD low set in January.
On the flip side, the 200-day SMA, currently pegged around the 82.20 region, might continue to act as an immediate strong barrier. A sustained move beyond might trigger a short-covering rally and lift the USD/INR pair towards the 82.70-82.80 supply zone. Some follow-through buying might then allow bulls to make a fresh attempt to conquer the 83.00 round-figure mark, which has been acting as a strong barrier since the beginning of this year.
Hence, a convincing breakthrough will be seen as a fresh trigger for bullish traders and set the stage for an extension of the USD/INR pair’s well-established uptrend witnessed since August 2022. Spot prices might then surpass the all-time peak, around the 83.40-83.45 region touched in October 2022, and aim to reclaim the 84.00 mark.
Technical Levels: Supports and Resistances
USDINR currently trading at 81.9935 at the time of writing. Pair opened at 82.0575 and is trading with a change of -0.08 % .
| Overview | Overview.1 | |
|---|---|---|
| 0 | Today last price | 81.9935 |
| 1 | Today Daily Change | -0.0640 |
| 2 | Today Daily Change % | -0.0800 |
| 3 | Today daily open | 82.0575 |
The pair remains strongly bearish on the daily time frame. It trades below the 20 SMA @ 82.1702, 50 SMA 82.2842, 100 SMA @ 82.1927 and 200 SMA @ 82.1654.
| Trends | Trends.1 | |
|---|---|---|
| 0 | Daily SMA20 | 82.1702 |
| 1 | Daily SMA50 | 82.2842 |
| 2 | Daily SMA100 | 82.1927 |
| 3 | Daily SMA200 | 82.1654 |
The previous day high was 82.122 while the previous day low was 81.8554. The daily 38.2% Fib levels comes at 82.0202, expected to provide resistance. Similarly, the daily 61.8% fib level is at 81.9573, expected to provide support.
Note the levels of interest below:
- Pivot support is noted at 81.9013, 81.7451, 81.6347
- Pivot resistance is noted at 82.1679, 82.2783, 82.4345
| Levels | Levels.1 |
|---|---|
| Previous Daily High | 82.1220 |
| Previous Daily Low | 81.8554 |
| Previous Weekly High | 82.2014 |
| Previous Weekly Low | 81.9116 |
| Previous Monthly High | 82.7370 |
| Previous Monthly Low | 81.8477 |
| Daily Fibonacci 38.2% | 82.0202 |
| Daily Fibonacci 61.8% | 81.9573 |
| Daily Pivot Point S1 | 81.9013 |
| Daily Pivot Point S2 | 81.7451 |
| Daily Pivot Point S3 | 81.6347 |
| Daily Pivot Point R1 | 82.1679 |
| Daily Pivot Point R2 | 82.2783 |
| Daily Pivot Point R3 | 82.4345 |
[/s2If]
Download Nehcap EAWe have two EAs that are operational on our LIVE accounts.
- EA-FIX: Check out the details here. Download EA-FIX . EA-FIX is a non-grid HFT scalper.
- EA-GROWTH: High quality low dd EA using trend grids. Download EA_GROWTHJoin Our Telegram Group
")


