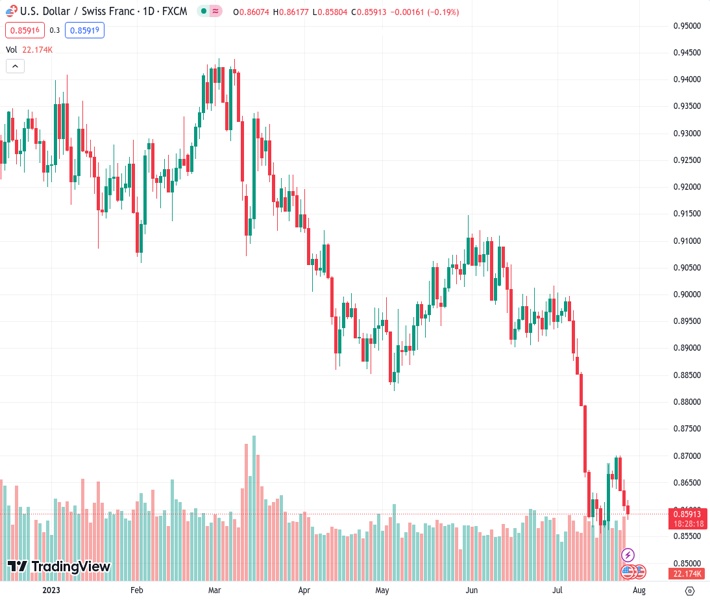
The USDCHF pair is experiencing downward pressure near 0.8600 due to the US dollar’s weakening.
…
This is a premium post.
[s2If !current_user_can(access_s2member_level4)]Please register for FREE REGISTER to read full post below containing analysis. In case of any error or you think you are not able to read the full post below, please email us at support#nehcap.com [lwa][/s2If] [s2If current_user_can(access_s2member_level1)]
- USD/CHF remains under pressure around 0.8600 amid the weakening of the USD.
The pair currently trades last at 0.85890.
The previous day high was 0.8656 while the previous day low was 0.8598. The daily 38.2% Fib levels comes at 0.862, expected to provide resistance. Similarly, the daily 61.8% fib level is at 0.8634, expected to provide resistance.
The USD/CHF pair remains under pressure below the 0.8600 region during the early Asian session on Thursday. The US dollar is weakening broadly following the Federal Open Market Committee (FOMC) meeting. The US dollar Index (DXY), a measure of the value of the Greenback against six other major currencies, dropped to 100.85. The pair currently trades around 0.8596, down 0.13% for the day.
Following the FOMC meeting, the central bank raised interest rates by 25 basis points (bps) to a target range of 5.25%–5.5%, as expected. Federal Reserve (Fed) Chairman Jerome Powell stated that the FOMC will assess the totality of incoming data, along with its implications for economic activity and inflation. He added that it’s possible to raise the Fed funds rate again at the September meeting if the data warrants it. After the FOMC meeting and statement, the US dollar weakened broadly, which acted as a headwind for USD/CHF.
On the Swiss franc front, the Swiss ZEW Survey Expectations data by the Centre for European Economic Research reported that the figure came in at -32.6 versus -30.8 prior and worse-than-expected 31.1.
Meanwhile, concern is high over whether China will deliver on its policy pledges, as China is the world’s second-biggest economy. On Tuesday, Chinese news agency Xinhua reported that Chinese policymakers would take up economic policy adjustments, strengthening confidence and mitigating risks. Market players will keep an eye on the headlines surrounding the Chinese stimulus plan. The Swiss Franc, a traditional safe-haven currency, could benefit from the absence of this development. Also, the renewed tension between China and the US remains in focus.
Moving on, the KOF Leading Indicator for July could offer clues about the Swiss Franc movement. Market players will also monitor US Advance GDP QoQ and the core Personal Consumption Expenditure (PCE) Price Index MoM for fresh impetus. Traders will monitor this development and find opportunities around the USD/CHF pair.
Technical Levels: Supports and Resistances
USDCHF currently trading at 0.8584 at the time of writing. Pair opened at 0.8608 and is trading with a change of -0.28 % .
| Overview | Overview.1 | |
|---|---|---|
| 0 | Today last price | 0.8584 |
| 1 | Today Daily Change | -0.0024 |
| 2 | Today Daily Change % | -0.2800 |
| 3 | Today daily open | 0.8608 |
The pair remains strongly bearish on the daily time frame. It trades below the 20 SMA @ 0.8764, 50 SMA 0.8915, 100 SMA @ 0.898 and 200 SMA @ 0.9198.
| Trends | Trends.1 | |
|---|---|---|
| 0 | Daily SMA20 | 0.8764 |
| 1 | Daily SMA50 | 0.8915 |
| 2 | Daily SMA100 | 0.8980 |
| 3 | Daily SMA200 | 0.9198 |
The previous day high was 0.8656 while the previous day low was 0.8598. The daily 38.2% Fib levels comes at 0.862, expected to provide resistance. Similarly, the daily 61.8% fib level is at 0.8634, expected to provide resistance.
Note the levels of interest below:
- Pivot support is noted at 0.8585, 0.8562, 0.8526
- Pivot resistance is noted at 0.8644, 0.868, 0.8703
| Levels | Levels.1 |
|---|---|
| Previous Daily High | 0.8656 |
| Previous Daily Low | 0.8598 |
| Previous Weekly High | 0.8684 |
| Previous Weekly Low | 0.8555 |
| Previous Monthly High | 0.9120 |
| Previous Monthly Low | 0.8902 |
| Daily Fibonacci 38.2% | 0.8620 |
| Daily Fibonacci 61.8% | 0.8634 |
| Daily Pivot Point S1 | 0.8585 |
| Daily Pivot Point S2 | 0.8562 |
| Daily Pivot Point S3 | 0.8526 |
| Daily Pivot Point R1 | 0.8644 |
| Daily Pivot Point R2 | 0.8680 |
| Daily Pivot Point R3 | 0.8703 |
[/s2If]
Download Nehcap EAWe have two EAs that are operational on our LIVE accounts.
- EA-FIX: Check out the details here. Download EA-FIX . EA-FIX is a non-grid HFT scalper.
- EA-GROWTH: High quality low dd EA using trend grids. Download EA_GROWTHJoin Our Telegram Group
")


