The USDCAD currency pair experienced its first daily loss in three days, but it is currently lacking momentum. Nehcap predicts that there will be limited downward movement in the near future.
…
This is a premium post.
[s2If !current_user_can(access_s2member_level4)]Please register for FREE REGISTER to read full post below containing analysis. In case of any error or you think you are not able to read the full post below, please email us at support#nehcap.com [lwa][/s2If] [s2If current_user_can(access_s2member_level1)]
- USD/CAD prints the first daily loss in three but lacks momentum of late.
The pair currently trades last at 1.31766.
The previous day high was 1.3238 while the previous day low was 1.3169. The daily 38.2% Fib levels comes at 1.3211, expected to provide resistance. Similarly, the daily 61.8% fib level is at 1.3195, expected to provide resistance.
USD/CAD remains on the back foot around the intraday low, despite lacking downside momentum heading into Thursday’s European session.
In doing so, the Loonie pair prints the first daily loss in three as markets await the first readings of the US Gross Domestic Product (GDP) Annualized for the second quarter (Q2), expected to ease to 1.8% from 2.0%. Also important to watch is the US Durable Goods Orders for June, likely easing to 1.0% from 1.8% prior (revised), as well as the monetary policy announcements from the European Central Bank (ECB).
That said, the Loonie pair remains within a fortnight-old triangle formation, currently between 1.3150 and 1.3225, following its corrective bounce off the lowest levels since September 2022 marked during mid-July.
It’s worth noting that the RSI (14) conditions suggest a continuation of a slower grind toward the south.
However, a one-month-old horizontal support zone near 1.3120-15 and the 1.3100 round figure may provide additional checks to the USD/CAD bears before directing them to the tops marked during May and June of 2022, close to 1.3080-75.
On the flip side, a convergence of the 200-Exponential Moving Average (EMA) and a descending resistance line from May 31, close to 1.3250 at the latest, appears a tough nut to crack for the USD/CAD bulls, apart from the stated triangle’s top line surrounding 1.3225.
In a case where the Loonie pair manages to remain firmer past 1.3225, the odds of witnessing a rally toward the monthly high of around 1.3390 can’t be ruled out.
Trend: Limited downside expected
Technical Levels: Supports and Resistances
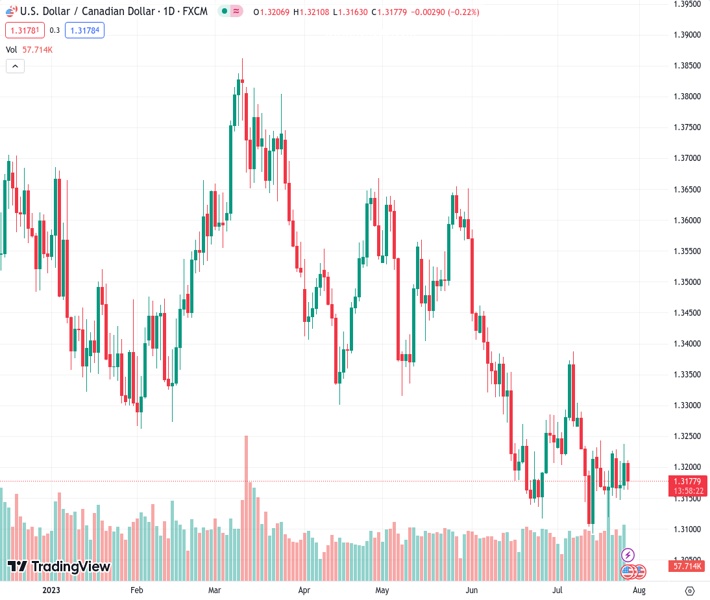
USDCAD currently trading at 1.3178 at the time of writing. Pair opened at 1.3208 and is trading with a change of -0.23% % .
| Overview | Overview.1 | |
|---|---|---|
| 0 | Today last price | 1.3178 |
| 1 | Today Daily Change | -0.0030 |
| 2 | Today Daily Change % | -0.23% |
| 3 | Today daily open | 1.3208 |
The pair remains strongly bearish on the daily time frame. It trades below the 20 SMA @ 1.322, 50 SMA 1.3316, 100 SMA @ 1.3435 and 200 SMA @ 1.3468.
| Trends | Trends.1 | |
|---|---|---|
| 0 | Daily SMA20 | 1.3220 |
| 1 | Daily SMA50 | 1.3316 |
| 2 | Daily SMA100 | 1.3435 |
| 3 | Daily SMA200 | 1.3468 |
The previous day high was 1.3238 while the previous day low was 1.3169. The daily 38.2% Fib levels comes at 1.3211, expected to provide resistance. Similarly, the daily 61.8% fib level is at 1.3195, expected to provide resistance.
Note the levels of interest below:
- Pivot support is noted at 1.3172, 1.3136, 1.3103
- Pivot resistance is noted at 1.3241, 1.3274, 1.331
| Levels | Levels.1 |
|---|---|
| Previous Daily High | 1.3238 |
| Previous Daily Low | 1.3169 |
| Previous Weekly High | 1.3244 |
| Previous Weekly Low | 1.3120 |
| Previous Monthly High | 1.3585 |
| Previous Monthly Low | 1.3117 |
| Daily Fibonacci 38.2% | 1.3211 |
| Daily Fibonacci 61.8% | 1.3195 |
| Daily Pivot Point S1 | 1.3172 |
| Daily Pivot Point S2 | 1.3136 |
| Daily Pivot Point S3 | 1.3103 |
| Daily Pivot Point R1 | 1.3241 |
| Daily Pivot Point R2 | 1.3274 |
| Daily Pivot Point R3 | 1.3310 |
[/s2If]
Download Nehcap EAWe have two EAs that are operational on our LIVE accounts.
- EA-FIX: Check out the details here. Download EA-FIX . EA-FIX is a non-grid HFT scalper.
- EA-GROWTH: High quality low dd EA using trend grids. Download EA_GROWTHJoin Our Telegram Group
")


