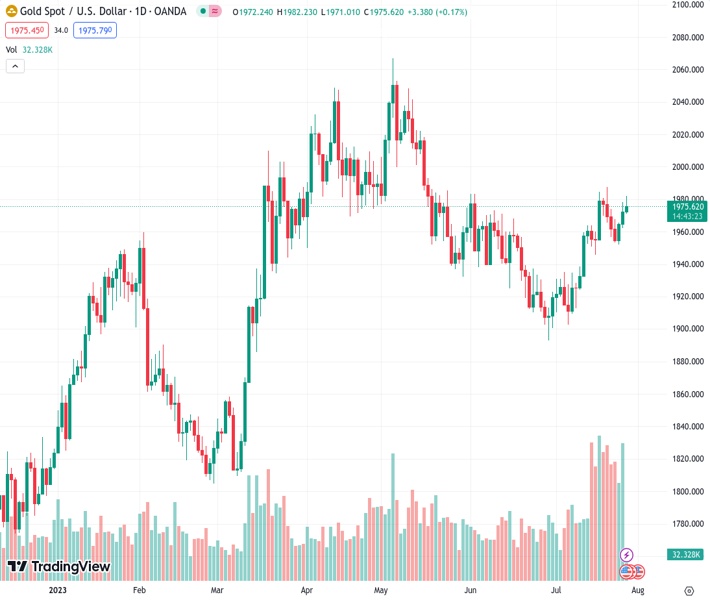
The upward trend in the price of gold, which reached $1,982, slowed down and lost momentum, currently standing at $1,975.32.
…
This is a premium post.
[s2If !current_user_can(access_s2member_level4)]Please register for FREE REGISTER to read full post below containing analysis. In case of any error or you think you are not able to read the full post below, please email us at support#nehcap.com [lwa][/s2If] [s2If current_user_can(access_s2member_level1)]
- Gold price recovery lost momentum after climbing to the $1,982 mark.
The pair currently trades last at 1975.32.
The previous day high was 1978.39 while the previous day low was 1962.06. The daily 38.2% Fib levels comes at 1972.15, expected to provide support. Similarly, the daily 61.8% fib level is at 1968.3, expected to provide support.
Gold price (XAU/USD) loses its traction after rising towards $1,982 heading into the early European session. Precious metals trade on a positive note for the third successive day on Thursday. XAU/USD currently trades near $1,975, up 0.19% for the day.
As expected, the Federal Open Market Committee (FOMC) hiked its interest rate by 25 basis points (bps) to a target range of 5.25%–5.5%. The rate was last seen just before the housing market collapse in 2007 and marked the highest level in more than 22 years.
Fed Chairman Jerome Powell stated following the rate decision that inflation has moderated somewhat since the middle of last year but that the Fed’s 2% target “has a long way to go. Even so, Powell left room for the Fed to keep rates unchanged at its September meeting. He added that the Fed will consider the incoming data for additional rate hikes if needed. The hints that the Fed could be close to the end of its rate-hike cycles might cap the downside in precious metals. It’s worth noting that gold is sensitive to rising interest rates as they raise the opportunity cost of holding non-yielding bullion.
Nevertheless, the ECB is expected to raise interest rates by 25 basis points (bps) on Thursday. Market participants speculate that the ECB will raise borrowing costs in July and September to bring inflation back to target. However, concern about the economic slowdown in the Eurozone might convince the central bank to pause rate hikes. Investors will take cues from ECB President Christine Lagarde about further monetary policy. A hawkish stance from the ECB might be a headwind for the gold price.
On the other hand, China, the world’s largest gold consumer, signaled additional support for the real estate sector and a series of measures to stimulate domestic consumption amid a sluggish post-COVID recovery. This, in turn, supports further upside in the gold price. The development of an additional stimulus plan in China will be in the spotlight for gold traders.
Moving on, market participants will focus on the first readings of the US Gross Domestic Product (GDP) for the second quarter (Q2), the core Personal Consumption Expenditure (PCE) Price Index MoM, Durable Goods Orders, and Initial Jobless Claims data later in the day. These data might influence the USD price dynamics and determine short-term trading opportunities around the gold price.
Technical Levels: Supports and Resistances
XAUUSD currently trading at 1975.81 at the time of writing. Pair opened at 1972.17 and is trading with a change of 0.18 % .
| Overview | Overview.1 | |
|---|---|---|
| 0 | Today last price | 1975.81 |
| 1 | Today Daily Change | 3.64 |
| 2 | Today Daily Change % | 0.18 |
| 3 | Today daily open | 1972.17 |
The pair remains strongly bullish on the daily timeframe. It trades above its 20 SMA @ 1944.52, 50 SMA 1947.2, 100 SMA @ 1964.53 and 200 SMA @ 1884.5.
| Trends | Trends.1 | |
|---|---|---|
| 0 | Daily SMA20 | 1944.52 |
| 1 | Daily SMA50 | 1947.20 |
| 2 | Daily SMA100 | 1964.53 |
| 3 | Daily SMA200 | 1884.50 |
The previous day high was 1978.39 while the previous day low was 1962.06. The daily 38.2% Fib levels comes at 1972.15, expected to provide support. Similarly, the daily 61.8% fib level is at 1968.3, expected to provide support.
Note the levels of interest below:
- Pivot support is noted at 1963.36, 1954.54, 1947.03
- Pivot resistance is noted at 1979.69, 1987.2, 1996.02
| Levels | Levels.1 |
|---|---|
| Previous Daily High | 1978.39 |
| Previous Daily Low | 1962.06 |
| Previous Weekly High | 1987.54 |
| Previous Weekly Low | 1945.85 |
| Previous Monthly High | 1983.50 |
| Previous Monthly Low | 1893.01 |
| Daily Fibonacci 38.2% | 1972.15 |
| Daily Fibonacci 61.8% | 1968.30 |
| Daily Pivot Point S1 | 1963.36 |
| Daily Pivot Point S2 | 1954.54 |
| Daily Pivot Point S3 | 1947.03 |
| Daily Pivot Point R1 | 1979.69 |
| Daily Pivot Point R2 | 1987.20 |
| Daily Pivot Point R3 | 1996.02 |
[/s2If]
Download Nehcap EAWe have two EAs that are operational on our LIVE accounts.
- EA-FIX: Check out the details here. Download EA-FIX . EA-FIX is a non-grid HFT scalper.
- EA-GROWTH: High quality low dd EA using trend grids. Download EA_GROWTHJoin Our Telegram Group
")


