The price of silver, represented by #XAGUSD, has retreated from a resistance level that was established two weeks ago, resulting in the first daily loss in three days. According to the viewpoint of @nehcap, it is anticipated that there will be a further decline in the price.
…
This is a premium post.
[s2If !current_user_can(access_s2member_level4)]Please register for FREE REGISTER to read full post below containing analysis. In case of any error or you think you are not able to read the full post below, please email us at support#nehcap.com [lwa][/s2If] [s2If current_user_can(access_s2member_level1)]
- Silver Price retreats from fortnight-old resistance to print the first daily loss in three.
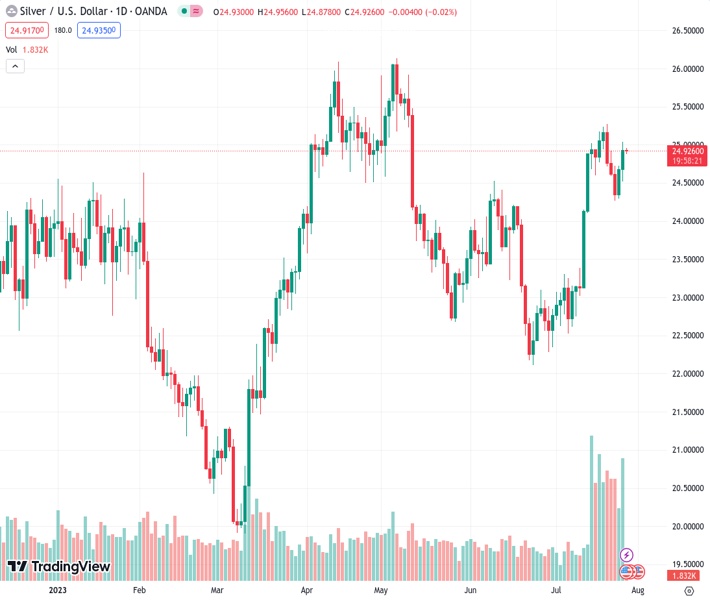
The pair currently trades last at 24.911.
The previous day high was 25.04 while the previous day low was 24.52. The daily 38.2% Fib levels comes at 24.84, expected to provide support. Similarly, the daily 61.8% fib level is at 24.72, expected to provide support.
Silver Price (XAG/USD) sticks to mild losses around $24.90 amid early Thursday morning in Asia, after rising in the last two consecutive days to refresh the weekly top.
That said, the XAG/USD’s latest pullback could be linked to the metal’s inability to cross a two-week-old horizontal resistance area around $25.00-05 by the press time.
Also luring the Silver sellers is the looming bear cross on the MACD and the RSI (14) line’s retreat from the overbought territory.
However, the 200-SMA level of around $24.80 restricts further downside of the XAG/USD, a break of which will highlight an upward-sloping support line from early July, close to $24.55 at the latest, for the Silver sellers to watch.
In a case where the Silver Price remains bearish past $24.55, the weekly bottom of around $24.25 will act as the final defense of the Silver buyers.
Meanwhile, a clear upside break of the aforementioned horizontal resistance area surrounding $25.00-05 will need validation from the monthly peak close to $25.30 to welcome the XAG/USD bulls.
Following that, a run-up to challenge the yearly top of around $26.15 will be in the spotlight.
Overall, the market’s cautious mood ahead of the first readings of the US Gross Domestic Product (GDP) for the second quarter (Q2), US Durable Goods Orders for June and the monetary policy meeting of the European Central Bank (ECB) prod the Silver buyers of late.
Trend: Further downside expected
Technical Levels: Supports and Resistances
XAGUSD currently trading at 24.9 at the time of writing. Pair opened at 24.93 and is trading with a change of -0.12% % .
| Overview | Overview.1 | |
|---|---|---|
| 0 | Today last price | 24.9 |
| 1 | Today Daily Change | -0.03 |
| 2 | Today Daily Change % | -0.12% |
| 3 | Today daily open | 24.93 |
The pair remains strongly bullish on the daily timeframe. It trades above its 20 SMA @ 23.94, 50 SMA 23.63, 100 SMA @ 23.84 and 200 SMA @ 23.0.
| Trends | Trends.1 | |
|---|---|---|
| 0 | Daily SMA20 | 23.94 |
| 1 | Daily SMA50 | 23.63 |
| 2 | Daily SMA100 | 23.84 |
| 3 | Daily SMA200 | 23.00 |
The previous day high was 25.04 while the previous day low was 24.52. The daily 38.2% Fib levels comes at 24.84, expected to provide support. Similarly, the daily 61.8% fib level is at 24.72, expected to provide support.
Note the levels of interest below:
- Pivot support is noted at 24.62, 24.31, 24.1
- Pivot resistance is noted at 25.14, 25.35, 25.66
| Levels | Levels.1 |
|---|---|
| Previous Daily High | 25.04 |
| Previous Daily Low | 24.52 |
| Previous Weekly High | 25.27 |
| Previous Weekly Low | 24.59 |
| Previous Monthly High | 24.53 |
| Previous Monthly Low | 22.11 |
| Daily Fibonacci 38.2% | 24.84 |
| Daily Fibonacci 61.8% | 24.72 |
| Daily Pivot Point S1 | 24.62 |
| Daily Pivot Point S2 | 24.31 |
| Daily Pivot Point S3 | 24.10 |
| Daily Pivot Point R1 | 25.14 |
| Daily Pivot Point R2 | 25.35 |
| Daily Pivot Point R3 | 25.66 |
[/s2If]
Download Nehcap EAWe have two EAs that are operational on our LIVE accounts.
- EA-FIX: Check out the details here. Download EA-FIX . EA-FIX is a non-grid HFT scalper.
- EA-GROWTH: High quality low dd EA using trend grids. Download EA_GROWTHJoin Our Telegram Group
")


