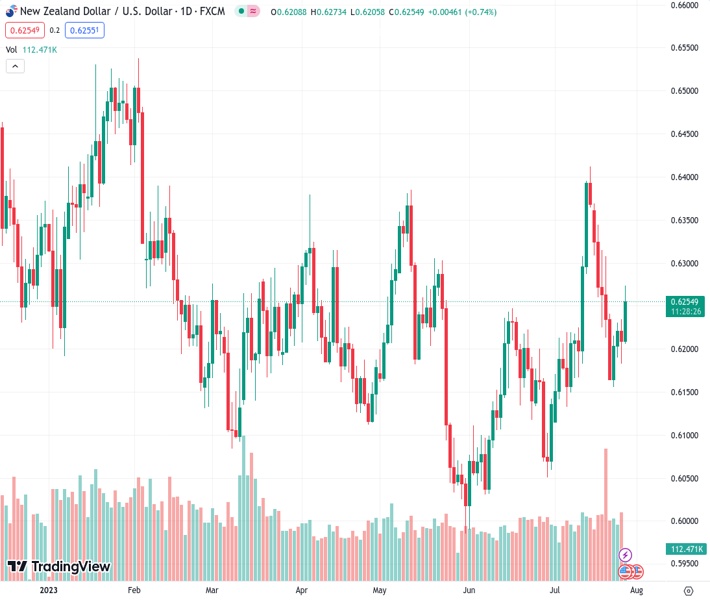
The currency pair NZDUSD, trading at the level of 0.62550, is experiencing a decrease in its level of fluctuation following a surge in value driven by a more accommodative stance from the Federal Reserve.
…
This is a premium post.
[s2If !current_user_can(access_s2member_level4)]Please register for FREE REGISTER to read full post below containing analysis. In case of any error or you think you are not able to read the full post below, please email us at support#nehcap.com [lwa][/s2If] [s2If current_user_can(access_s2member_level1)]
- NZD/USD shows a decline in volatility after a rally move propelled by less-hawkish Fed policy.
The pair currently trades last at 0.62550.
The previous day high was 0.6236 while the previous day low was 0.6183. The daily 38.2% Fib levels comes at 0.6203, expected to provide support. Similarly, the daily 61.8% fib level is at 0.6216, expected to provide support.
The NZD/USD pair demonstrates signs of volatility contraction around 0.6250 in the London session. The Kiwi asset turns sideways after a solid upside move as investors are awaiting the United States Gross Domestic Product (GDP) data, which will release at 12:00 GMT.
Meanwhile, strength in the Kiwi asset has been propelled by less-hawkish monetary policy by the Federal Reserve (Fed) announced on Wednesday. Fed hikes interest rates by 25 basis points (bps) to 5.25-5.50%. Investors are taking July’s interest rate as the last one in the current tightening spell.
The US Dollar Index (DXY) has extended its correction sharply to near 100.58 as fears of a recession in the United States have eased significantly.
NZD/USD tests the strength of the breakout formed around 0.6235 on an hourly scale. The asset delivered the breakout of the consolidation formed in a range of 0.6180-0.6230, which results in wider ticks and heavy volume. Upward-sloping 20-period Exponential Moving Average (EMA) at 0.6240 is providing support to the New Zealand Dollar bulls.
The Relative Strength Index (RSI) (14) has shifted into the bullish range of 60.00-80.00, which indicates that the bullish momentum is active.
A decisive break above July 27 high at 0.6274 would drive the asset toward July 20 high around 0.6310 followed by July 17 high at 0.6369.
On the flip side, a downside move below the weekly low at 0.615 would send the major toward the round-level support at 0.6100. Slippage below the latter would expose the asset to June 29 low at 0.6050.
Technical Levels: Supports and Resistances
NZDUSD currently trading at 0.626 at the time of writing. Pair opened at 0.621 and is trading with a change of 0.81 % .
| Overview | Overview.1 | |
|---|---|---|
| 0 | Today last price | 0.626 |
| 1 | Today Daily Change | 0.005 |
| 2 | Today Daily Change % | 0.810 |
| 3 | Today daily open | 0.621 |
The pair remains strongly bullish on the daily timeframe. It trades above its 20 SMA @ 0.6221, 50 SMA 0.6168, 100 SMA @ 0.6197 and 200 SMA @ 0.6214.
| Trends | Trends.1 | |
|---|---|---|
| 0 | Daily SMA20 | 0.6221 |
| 1 | Daily SMA50 | 0.6168 |
| 2 | Daily SMA100 | 0.6197 |
| 3 | Daily SMA200 | 0.6214 |
The previous day high was 0.6236 while the previous day low was 0.6183. The daily 38.2% Fib levels comes at 0.6203, expected to provide support. Similarly, the daily 61.8% fib level is at 0.6216, expected to provide support.
Note the levels of interest below:
- Pivot support is noted at 0.6183, 0.6156, 0.6129
- Pivot resistance is noted at 0.6237, 0.6263, 0.629
| Levels | Levels.1 |
|---|---|
| Previous Daily High | 0.6236 |
| Previous Daily Low | 0.6183 |
| Previous Weekly High | 0.6370 |
| Previous Weekly Low | 0.6163 |
| Previous Monthly High | 0.6250 |
| Previous Monthly Low | 0.5990 |
| Daily Fibonacci 38.2% | 0.6203 |
| Daily Fibonacci 61.8% | 0.6216 |
| Daily Pivot Point S1 | 0.6183 |
| Daily Pivot Point S2 | 0.6156 |
| Daily Pivot Point S3 | 0.6129 |
| Daily Pivot Point R1 | 0.6237 |
| Daily Pivot Point R2 | 0.6263 |
| Daily Pivot Point R3 | 0.6290 |
[/s2If]
Download Nehcap EAWe have two EAs that are operational on our LIVE accounts.
- EA-FIX: Check out the details here. Download EA-FIX . EA-FIX is a non-grid HFT scalper.
- EA-GROWTH: High quality low dd EA using trend grids. Download EA_GROWTHJoin Our Telegram Group
")


