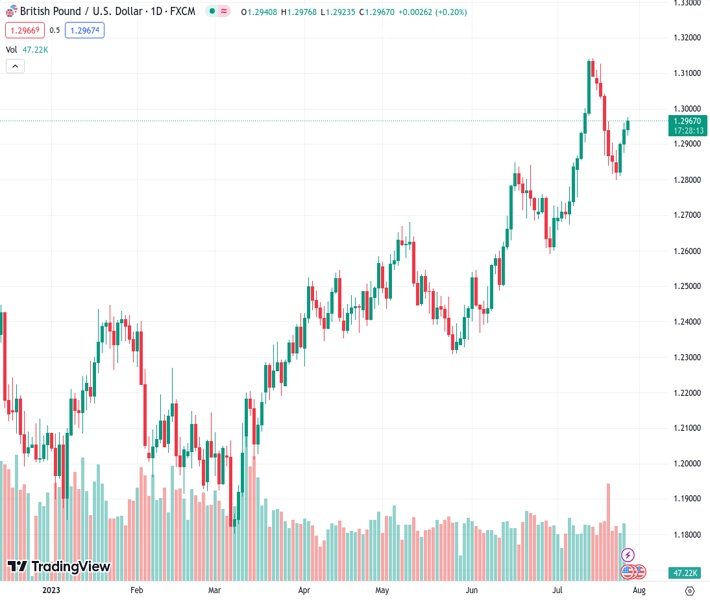
The British pound against the US dollar, at a rate of 1.29682, continues to rise for the third consecutive day and reaches a level that hasn’t been seen in over a week.
…
This is a premium post.
[s2If !current_user_can(access_s2member_level4)]Please register for FREE REGISTER to read full post below containing analysis. In case of any error or you think you are not able to read the full post below, please email us at support#nehcap.com [lwa][/s2If] [s2If current_user_can(access_s2member_level1)]
- GBP/USD scales higher for the third straight day and climbs to over a one-week high.
The pair currently trades last at 1.29682.
The previous day high was 1.2961 while the previous day low was 1.2876. The daily 38.2% Fib levels comes at 1.2928, expected to provide support. Similarly, the daily 61.8% fib level is at 1.2908, expected to provide support.
The GBP/USD pair builds on this week’s goodish rebound from sub-1.2800 levels and gains some follow-through positive traction for the third successive day on Thursday. Spot prices jump to over a one-week high during the Asian session and currently trade around the 1.2965 region, up just over 0.20% for the day.
The US Dollar (USD) is seen prolonging its retracement slide from a two-week high touched on Tuesday and turning out to be a key factor acting as a tailwind for the GBP/USD pair. Despite the fact that the Federal Reserve (Fed) left the door open for one more rate hike in September or November, consensus that the US central bank is nearing the end of its current policy tightening cycle drag the Greenback lower for the third straight day.
It is worth recalling that Fed Chair Jerome Powell, speaking to the press after the widely expected 25 bps lift-off on Wednesday, said that the economy still needs to slow and the labour market to weaken for inflation to credibly return to the 2% target. That said, further moderation in inflation and weaker economic data might force the Fed to pause. Apart from this, a generally positive risk tone further undermines the safe-haven Greenback.
Investors continue to cheer China’s pledge to step up support for its fragile economy, which remains supportive of the bullish sentiment across the global equity markets. It is worth recalling that state news agency Xinhua cited the Politburo – the top decision-making body of the ruling Communist Party – saying that China will step up economic policy adjustments, focusing on expanding domestic demand, boosting confidence and preventing risks.
That said, diminishing odds for more aggressive rate hikes by the Bank of England (BoE), bolstered by last week’s softer UK consumer inflation figures, could cap the British Pound (GBP). This, in turn, might hold back bulls from placing fresh bets around the GBP/USD pair. Hence, it will be prudent to wait for a move back above the 1.3000 psychological mark before confirming that the corrective decline from a 15-month peak has run its course.
In the absence of any relevant market-moving economic data from the UK, the USD price dynamics will continue to act as an exclusive driver of the GBP/USD pair’s intraday movement. Later during the early North American session, traders will take cues from the US economic docket – featuring the release of the Advance Q2 GDP report, Durable Goods Orders, the usual Weekly Initial Jobless Claims and Pending Home Sales data.
Technical Levels: Supports and Resistances
GBPUSD currently trading at 1.2966 at the time of writing. Pair opened at 1.2941 and is trading with a change of 0.19 % .
| Overview | Overview.1 | |
|---|---|---|
| 0 | Today last price | 1.2966 |
| 1 | Today Daily Change | 0.0025 |
| 2 | Today Daily Change % | 0.1900 |
| 3 | Today daily open | 1.2941 |
The pair remains strongly bullish on the daily timeframe. It trades above its 20 SMA @ 1.2873, 50 SMA 1.2682, 100 SMA @ 1.2537 and 200 SMA @ 1.227.
| Trends | Trends.1 | |
|---|---|---|
| 0 | Daily SMA20 | 1.2873 |
| 1 | Daily SMA50 | 1.2682 |
| 2 | Daily SMA100 | 1.2537 |
| 3 | Daily SMA200 | 1.2270 |
The previous day high was 1.2961 while the previous day low was 1.2876. The daily 38.2% Fib levels comes at 1.2928, expected to provide support. Similarly, the daily 61.8% fib level is at 1.2908, expected to provide support.
Note the levels of interest below:
- Pivot support is noted at 1.2891, 1.2841, 1.2806
- Pivot resistance is noted at 1.2976, 1.3011, 1.3061
| Levels | Levels.1 |
|---|---|
| Previous Daily High | 1.2961 |
| Previous Daily Low | 1.2876 |
| Previous Weekly High | 1.3126 |
| Previous Weekly Low | 1.2816 |
| Previous Monthly High | 1.2848 |
| Previous Monthly Low | 1.2369 |
| Daily Fibonacci 38.2% | 1.2928 |
| Daily Fibonacci 61.8% | 1.2908 |
| Daily Pivot Point S1 | 1.2891 |
| Daily Pivot Point S2 | 1.2841 |
| Daily Pivot Point S3 | 1.2806 |
| Daily Pivot Point R1 | 1.2976 |
| Daily Pivot Point R2 | 1.3011 |
| Daily Pivot Point R3 | 1.3061 |
[/s2If]
Download Nehcap EAWe have two EAs that are operational on our LIVE accounts.
- EA-FIX: Check out the details here. Download EA-FIX . EA-FIX is a non-grid HFT scalper.
- EA-GROWTH: High quality low dd EA using trend grids. Download EA_GROWTHJoin Our Telegram Group
")


