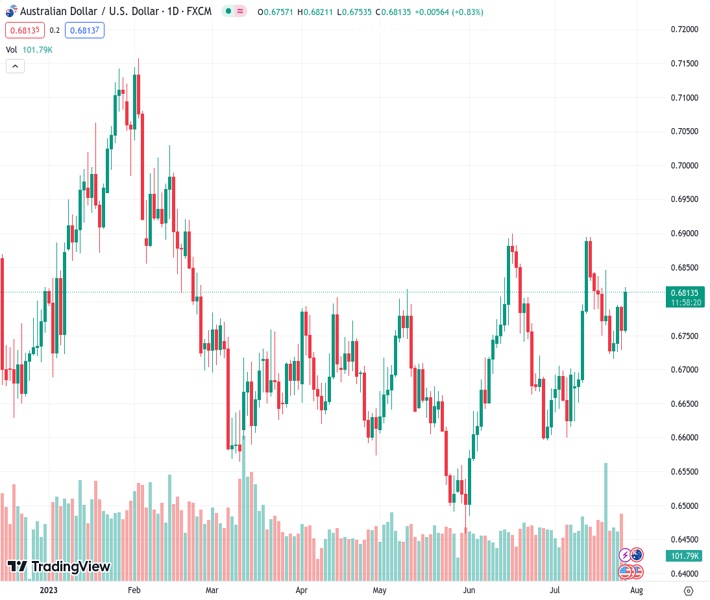
The Australian dollar to US dollar exchange rate, currently at 0.68120, has risen to its highest level in a week due to continued selling of the US dollar, which is helping to support the AUDUSD.
…
This is a premium post.
[s2If !current_user_can(access_s2member_level4)]Please register for FREE REGISTER to read full post below containing analysis. In case of any error or you think you are not able to read the full post below, please email us at support#nehcap.com [lwa][/s2If] [s2If current_user_can(access_s2member_level1)]
- AUD/USD climbs to a one-week high and draws support from sustained USD selling bias.
The pair currently trades last at 0.68120.
The previous day high was 0.6794 while the previous day low was 0.673. The daily 38.2% Fib levels comes at 0.6755, expected to provide support. Similarly, the daily 61.8% fib level is at 0.677, expected to provide support.
The AUD/USD pair regains positive traction following the previous day’s softer Australian consumer inflation-inspired losses and climbs to a one-week during the first half of trading on Thursday. The pair maintains its strong bid tone through the early European session and is currently placed around the 0.6815-0.6820 region, up over 0.80% for the day.
In the absence of any fresh hawkish signals from the Federal Reserve (Fed), the US Dollar (USD) prolongs its retracement slide from a two-week peak for the third successive day and turns out to be a key factor acting as a tailwind for the AUD/USD pair. In fact, market participants now seem convinced that the US central bank is nearing the end of its current rate-hiking cycle. This, along with the risk-on environment, bolstered by hopes for more stimulus from China and the fact that Fed Chair Jerome Powell downplayed expectations for a US recession this year, undermines the safe-haven buck and benefits the risk-sensitive Aussie.
From a technical perspective, the recent corrective decline from the vicinity of the 0.6900 mark, which constituted the formation of a bearish double-top pattern on the daily chart, stalled near the very important 200-day Simple Moving Average (SMA). The subsequent move up and acceptance above the 0.6800 mark now seems to have shifted the bias back in favour of bulls. Traders, however, seem reluctant to place aggressive bets ahead of the Advance Q2 GDP report from the US, due later during the early North American session. Nevertheless, the setup suggests that the path of least resistance for spot prices is to the upside.
Hence, some follow-through strength towards testing the next relevant hurdle, around the 0.6845-0.6850 region, looks like a distinct possibility. The momentum could get extended further and allow the AUD/USD pair to make a fresh attempt towards conquering the 0.6900 round figure. A sustained move beyond the said handle will negate the bearish pattern and push spot prices to the 0.6970-0.6975 resistance en route to the 0.7000 psychological mark. The momentum could get extended towards the 0.7050-0.7055 area, the 0.7100 round figure and the YTD peak, around the 0.7155-0.7160 region touched in February.
On the flip side, any intraday pullback below the 0.6800 mark now seems to find decent support near the 0.6760-0.6755 region. This is followed by the 200-day SMA pivotal support, currently pegged around the 0.6730 area, which if broken decisively will shift the bias in favour of bearish traders. The AUD/USD pair might then turn vulnerable to weaken further below the 0.6700 mark and drop to the 0.6695-0.6690 confluence support, comprising the 100-day and the 50-day SMAs. Some follow-through selling will validate the bearish double-top pattern and expose the monthly low, around the 0.6600 round figure.
Technical Levels: Supports and Resistances
AUDUSD currently trading at 0.6815 at the time of writing. Pair opened at 0.6758 and is trading with a change of 0.84 % .
| Overview | Overview.1 | |
|---|---|---|
| 0 | Today last price | 0.6815 |
| 1 | Today Daily Change | 0.0057 |
| 2 | Today Daily Change % | 0.8400 |
| 3 | Today daily open | 0.6758 |
The pair remains strongly bullish on the daily timeframe. It trades above its 20 SMA @ 0.6735, 50 SMA 0.6697, 100 SMA @ 0.6691 and 200 SMA @ 0.6725.
| Trends | Trends.1 | |
|---|---|---|
| 0 | Daily SMA20 | 0.6735 |
| 1 | Daily SMA50 | 0.6697 |
| 2 | Daily SMA100 | 0.6691 |
| 3 | Daily SMA200 | 0.6725 |
The previous day high was 0.6794 while the previous day low was 0.673. The daily 38.2% Fib levels comes at 0.6755, expected to provide support. Similarly, the daily 61.8% fib level is at 0.677, expected to provide support.
Note the levels of interest below:
- Pivot support is noted at 0.6728, 0.6697, 0.6664
- Pivot resistance is noted at 0.6791, 0.6824, 0.6854
| Levels | Levels.1 |
|---|---|
| Previous Daily High | 0.6794 |
| Previous Daily Low | 0.6730 |
| Previous Weekly High | 0.6854 |
| Previous Weekly Low | 0.6722 |
| Previous Monthly High | 0.6900 |
| Previous Monthly Low | 0.6484 |
| Daily Fibonacci 38.2% | 0.6755 |
| Daily Fibonacci 61.8% | 0.6770 |
| Daily Pivot Point S1 | 0.6728 |
| Daily Pivot Point S2 | 0.6697 |
| Daily Pivot Point S3 | 0.6664 |
| Daily Pivot Point R1 | 0.6791 |
| Daily Pivot Point R2 | 0.6824 |
| Daily Pivot Point R3 | 0.6854 |
[/s2If]
Download Nehcap EAWe have two EAs that are operational on our LIVE accounts.
- EA-FIX: Check out the details here. Download EA-FIX . EA-FIX is a non-grid HFT scalper.
- EA-GROWTH: High quality low dd EA using trend grids. Download EA_GROWTHJoin Our Telegram Group
")


