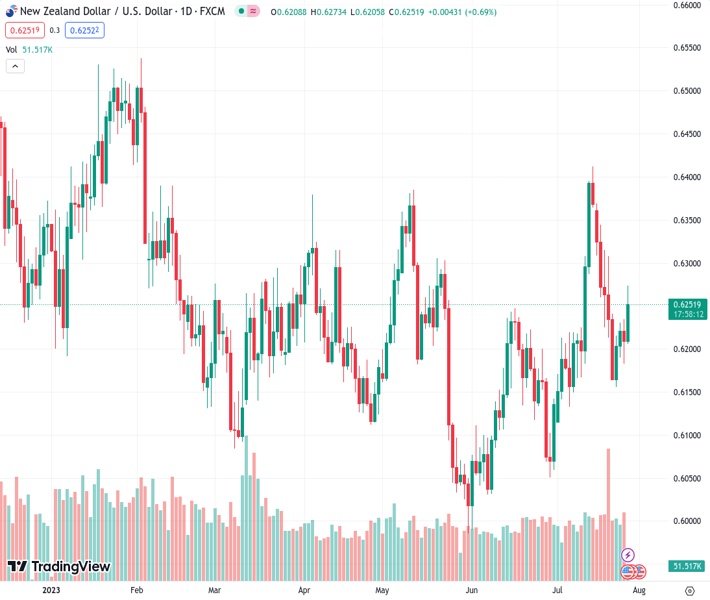
#NZDUSD @ 0.62539 takes the bids to renew weekly top, prints the biggest daily gains in a fortnight.
…
This is a premium post.
[s2If !current_user_can(access_s2member_level4)]Please register for FREE REGISTER to read full post below containing analysis. In case of any error or you think you are not able to read the full post below, please email us at support#nehcap.com [lwa][/s2If] [s2If current_user_can(access_s2member_level1)]
- NZD/USD takes the bids to renew weekly top, prints the biggest daily gains in a fortnight.
The pair currently trades last at 0.62539.
The previous day high was 0.6236 while the previous day low was 0.6183. The daily 38.2% Fib levels comes at 0.6203, expected to provide support. Similarly, the daily 61.8% fib level is at 0.6216, expected to provide support.
NZD/USD prints the biggest daily gains in two weeks, so far, as it rises to 0.6274 amid early Thursday morning in Europe. In doing so, the Kiwi pair not only cheers the broad-based US Dollar weakness but also justifies a recovery in China’s industrial losses.
That said, China’s Industrial Profits for the January-June period shrink 16.8% compared to the -18.8% figure marked for the first five months of the year 2023, per China’s National Bureau of Statistics (NBS) data released early Thursday. It’s worth noting that numbers for June came in as -8.3% YoY versus -12.6% prior.
Elsewhere, the US Dollar Index (DXY) fails to cheer the Federal Reserve’s (Fed) hawkish rate hike amid fears of a sooner end to the tightening spell. With this, the DXY prints a three-day losing streak, down 0.24% intraday near 100.78 by the press time.
It’s worth observing that the Fed announced the widely anticipated interest rate hike toward the multi-year high in the range of 5.25%-5.50%. Following the rate decision, Fed Chairman Jerome Powell tried to lure the hawks by showing readiness for a September rate hike as he said, that the June inflation Consumer Price Index was welcomed but “was only one month’s report.” It should be noted that the rejection of recession fears was also an effort to please the US Dollar buyers but failed.
Apart from that, the mixed US data flag concerns about the end of the Fed’s rate hike trajectory and exert downside pressure on the greenback, especially amid the market’s cautious optimism.
US Conference Board’s (CB) Consumer Confidence Index for July has been positive but the housing numbers for June are mixed. That said, the previously released inflation and employment clues haven’t been impressive and prod the US Dollar Index buyers. Even so, the International Monetary Fund (IMF) raised the US economic growth forecast for 2023 to 1.8% from 1.6% forecast in April.
Moving on, the first readings of the US Gross Domestic Product (GDP) Annualized for the second quarter (Q2), expected to ease to 1.8% from 2.0%, will be important to watch for clear directions. Also crucial will be the US Durable Goods Orders for June, likely easing to 1.0% from 1.8% prior (revised), as well as the monetary policy announcements from the European Central Bank (ECB).
A clear upside break of a two-week-old descending trend line and sustained rebound from the 50-DMA, currently intersecting each other around 0.6170, keeps the NZD/USD buyers hopeful.
Technical Levels: Supports and Resistances
NZDUSD currently trading at 0.626 at the time of writing. Pair opened at 0.621 and is trading with a change of 0.81% % .
| Overview | Overview.1 | |
|---|---|---|
| 0 | Today last price | 0.626 |
| 1 | Today Daily Change | 0.0050 |
| 2 | Today Daily Change % | 0.81% |
| 3 | Today daily open | 0.621 |
The pair remains strongly bullish on the daily timeframe. It trades above its 20 SMA @ 0.6221, 50 SMA 0.6168, 100 SMA @ 0.6197 and 200 SMA @ 0.6214.
| Trends | Trends.1 | |
|---|---|---|
| 0 | Daily SMA20 | 0.6221 |
| 1 | Daily SMA50 | 0.6168 |
| 2 | Daily SMA100 | 0.6197 |
| 3 | Daily SMA200 | 0.6214 |
The previous day high was 0.6236 while the previous day low was 0.6183. The daily 38.2% Fib levels comes at 0.6203, expected to provide support. Similarly, the daily 61.8% fib level is at 0.6216, expected to provide support.
Note the levels of interest below:
- Pivot support is noted at 0.6183, 0.6156, 0.6129
- Pivot resistance is noted at 0.6237, 0.6263, 0.629
| Levels | Levels.1 |
|---|---|
| Previous Daily High | 0.6236 |
| Previous Daily Low | 0.6183 |
| Previous Weekly High | 0.6370 |
| Previous Weekly Low | 0.6163 |
| Previous Monthly High | 0.6250 |
| Previous Monthly Low | 0.5990 |
| Daily Fibonacci 38.2% | 0.6203 |
| Daily Fibonacci 61.8% | 0.6216 |
| Daily Pivot Point S1 | 0.6183 |
| Daily Pivot Point S2 | 0.6156 |
| Daily Pivot Point S3 | 0.6129 |
| Daily Pivot Point R1 | 0.6237 |
| Daily Pivot Point R2 | 0.6263 |
| Daily Pivot Point R3 | 0.6290 |
[/s2If]
Download Nehcap EAWe have two EAs that are operational on our LIVE accounts.
- EA-FIX: Check out the details here. Download EA-FIX . EA-FIX is a non-grid HFT scalper.
- EA-GROWTH: High quality low dd EA using trend grids. Download EA_GROWTHJoin Our Telegram Group
")


