Gold price is trading in a positive manner for three consecutive days and remains close to the highest point it reached this week.
…
This is a premium post.
[s2If !current_user_can(access_s2member_level4)]Please register for FREE REGISTER to read full post below containing analysis. In case of any error or you think you are not able to read the full post below, please email us at support#nehcap.com [lwa][/s2If] [s2If current_user_can(access_s2member_level1)]
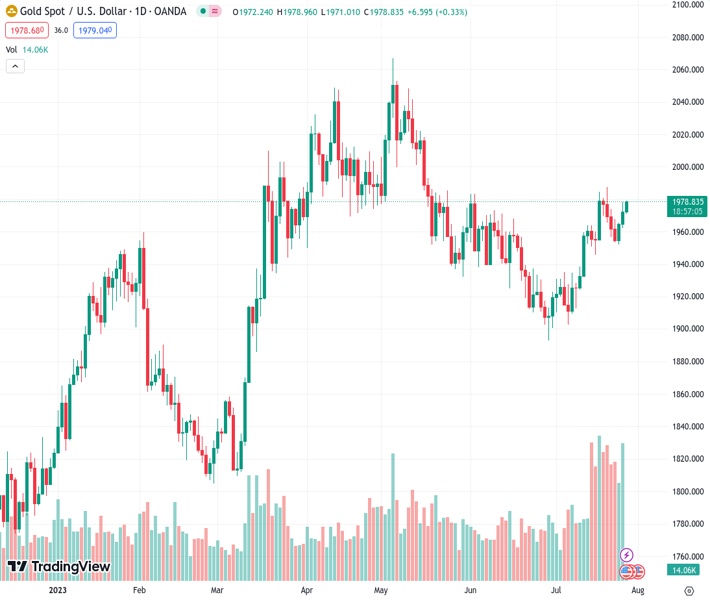
- Gold price trades with positive bias for the third straight day and hovers near the weekly high.
The pair currently trades last at 1978.34.
The previous day high was 1978.39 while the previous day low was 1962.06. The daily 38.2% Fib levels comes at 1972.15, expected to provide support. Similarly, the daily 61.8% fib level is at 1968.3, expected to provide support.
Gold price gains some positive traction for the third successive day on Thursday and climbs to the $1,975 area during the Asian session, back closer to the weekly high touched the previous day. The XAU/USD might now look to build on this week’s positive move from the vicinity of the $1,950 level and remains well within the striking distance of over a two-month high set last week.
The Federal Reserve (Fed) on Wednesday, as was expected, raised interest rates by 25 basis points (bps) to the 5.25%-5.50% range, or the highest level in 22 years, citing still-elevated inflation as the rationale. In the post-meeting press conference, Fed Chair Jerome Powell said that the economy still needs to slow and the labour market to weaken for inflation to credibly return to the 2% target. This leaves the door open for one more rate hike in September or November, which assists the US Dollar (USD) to stall its corrective decline from a two-week high touched on Tuesday and might turn out to be a key factor capping the Gold price.
Furthermore, expectations for additional rate hikes by the European Central Bank (ECB) and the Bank of England (BoE) further contribute to keeping a lid on the non-yielding yellow metal, for now. In fact, investors seem convinced that the ECB will increase borrowing costs in July and September. The BoE, meanwhile, is anticipated to hike interest rates by 25 bps in every meeting through November. The bets were lifted by the recent upside surprise to pay growth, though softer consumer inflation figures from the United Kingdom (UK) last week pushed back against expectations for a more aggressive policy tightening by the central bank.
The downside for the Gold price, however, remains cushioned in the wake of a general consensus that the Fed is getting closer to the end of its current interest rate-hiking cycle. Apart from this, worries about a global economic downturn, geopolitical risks and the worsening relations between the United States (US) and China – the world’s two largest economies – should continue to lend support to the safe-haven precious metal. The aforementioned mixed fundamental backdrop, meanwhile, warrants some caution before placing aggressive bets around the XAU/USD and positioning for a firm near-term directional move.
Market participants now look forward to the ECB policy decision, which, along with important US macro data, should provide some meaningful impetus to the Gold price. Thursday’s US economic docket features the release of the Advance GDP report for the second quarter, Durable Goods Orders, the usual Weekly Initial Jobless Claims and Pending Home Sales data. This might influence the USD price dynamics and produce short-term trading opportunities around the XAU/USD. The market focus will then shift to the release of the Fed’s preferred inflation gauge, the Core Personal Consumption Expenditures (PCE) Price Index, due on Friday.
Technical Levels: Supports and Resistances
XAUUSD currently trading at 1975.0 at the time of writing. Pair opened at 1972.17 and is trading with a change of 0.14 % .
| Overview | Overview.1 | |
|---|---|---|
| 0 | Today last price | 1975.00 |
| 1 | Today Daily Change | 2.83 |
| 2 | Today Daily Change % | 0.14 |
| 3 | Today daily open | 1972.17 |
The pair remains strongly bullish on the daily timeframe. It trades above its 20 SMA @ 1944.52, 50 SMA 1947.2, 100 SMA @ 1964.53 and 200 SMA @ 1884.5.
| Trends | Trends.1 | |
|---|---|---|
| 0 | Daily SMA20 | 1944.52 |
| 1 | Daily SMA50 | 1947.20 |
| 2 | Daily SMA100 | 1964.53 |
| 3 | Daily SMA200 | 1884.50 |
The previous day high was 1978.39 while the previous day low was 1962.06. The daily 38.2% Fib levels comes at 1972.15, expected to provide support. Similarly, the daily 61.8% fib level is at 1968.3, expected to provide support.
Note the levels of interest below:
- Pivot support is noted at 1963.36, 1954.54, 1947.03
- Pivot resistance is noted at 1979.69, 1987.2, 1996.02
| Levels | Levels.1 |
|---|---|
| Previous Daily High | 1978.39 |
| Previous Daily Low | 1962.06 |
| Previous Weekly High | 1987.54 |
| Previous Weekly Low | 1945.85 |
| Previous Monthly High | 1983.50 |
| Previous Monthly Low | 1893.01 |
| Daily Fibonacci 38.2% | 1972.15 |
| Daily Fibonacci 61.8% | 1968.30 |
| Daily Pivot Point S1 | 1963.36 |
| Daily Pivot Point S2 | 1954.54 |
| Daily Pivot Point S3 | 1947.03 |
| Daily Pivot Point R1 | 1979.69 |
| Daily Pivot Point R2 | 1987.20 |
| Daily Pivot Point R3 | 1996.02 |
[/s2If]
Download Nehcap EAWe have two EAs that are operational on our LIVE accounts.
- EA-FIX: Check out the details here. Download EA-FIX . EA-FIX is a non-grid HFT scalper.
- EA-GROWTH: High quality low dd EA using trend grids. Download EA_GROWTHJoin Our Telegram Group
")


