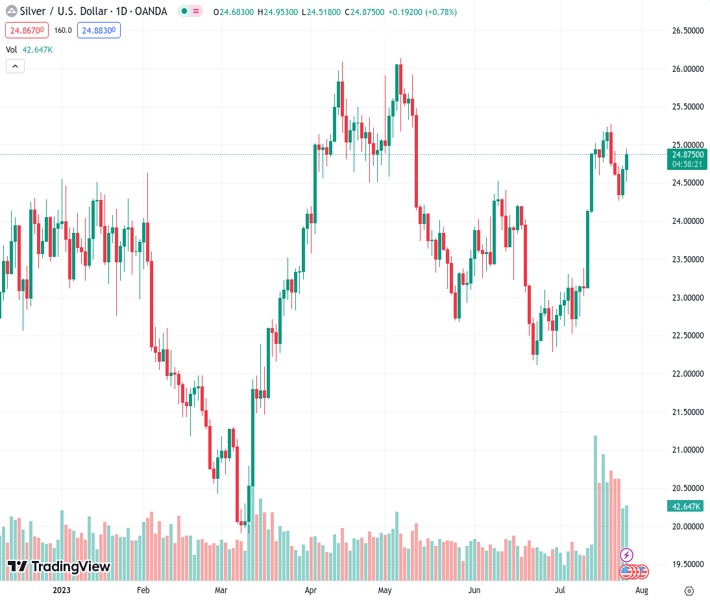
The XAGUSD currency pair, trading at 24.869, experienced an increase and advanced by $24.90, indicating a 1% growth.
…
This is a premium post.
[s2If !current_user_can(access_s2member_level4)]Please register for FREE REGISTER to read full post below containing analysis. In case of any error or you think you are not able to read the full post below, please email us at support#nehcap.com [lwa][/s2If] [s2If current_user_can(access_s2member_level1)]
- XAG/USD gained ground and rose $24.90, showing 1% gains.
The pair currently trades last at 24.869.
The previous day high was 24.73 while the previous day low was 24.3. The daily 38.2% Fib levels comes at 24.56, expected to provide support. Similarly, the daily 61.8% fib level is at 24.46, expected to provide support.
On Wednesday, the XAG/USD Silver spot price capitalised on the USD softness and falling US yields and jumped near the $25.00 area.
Ahead of the Federal Reserve (Fed) decision, the USD is trading soft, with the DXY index setting a consecutive day of losses after five straight days of gains. In addition, the 2-year American bond yield stands neutral at 4.88% and the 5 and 10-year rates fell to 4.14% and 3.87%, respectively, allowing the XAG/USD to gain traction.
Regarding the decision, markets have already priced in a 25 basis point (bps) hike, and the focus is on the Fed’s posture regarding forward guidance. Chair Powell commented in June that the considered “prudent” additional hikes but that monetary policy decisions will remain data dependent. As for now, according to the World Interest Rate Possibility (WIRP) tool, markets discount 20% odds of a hike in September and then 45% probabilities in November.
The daily chart shows that the XAG/USD’s technical outlook is neutral for the short term as indicators have turned somewhat flat, awaiting a catalyst. The Relative Strength Index (RSI) has a slight positive slope, while the Moving Average Convergence Divergence (MACD) prints fading green bars. However, the 20 and 100-day Simple Moving Averages (SMA) have already performed a bullish cross which could offer critical support to the grey metal. Traders should pay attention to these movements.
Support levels: $24.30, $24.00, $23.90 (20-day SMA).
Resistance levels: $25.00, $25.30, $25.50.
Technical Levels: Supports and Resistances
XAGUSD currently trading at 24.91 at the time of writing. Pair opened at 24.68 and is trading with a change of 0.93 % .
| Overview | Overview.1 | |
|---|---|---|
| 0 | Today last price | 24.91 |
| 1 | Today Daily Change | 0.23 |
| 2 | Today Daily Change % | 0.93 |
| 3 | Today daily open | 24.68 |
The pair remains strongly bullish on the daily timeframe. It trades above its 20 SMA @ 23.82, 50 SMA 23.6, 100 SMA @ 23.79 and 200 SMA @ 22.97.
| Trends | Trends.1 | |
|---|---|---|
| 0 | Daily SMA20 | 23.82 |
| 1 | Daily SMA50 | 23.60 |
| 2 | Daily SMA100 | 23.79 |
| 3 | Daily SMA200 | 22.97 |
The previous day high was 24.73 while the previous day low was 24.3. The daily 38.2% Fib levels comes at 24.56, expected to provide support. Similarly, the daily 61.8% fib level is at 24.46, expected to provide support.
Note the levels of interest below:
- Pivot support is noted at 24.41, 24.14, 23.98
- Pivot resistance is noted at 24.84, 25.0, 25.27
| Levels | Levels.1 |
|---|---|
| Previous Daily High | 24.73 |
| Previous Daily Low | 24.30 |
| Previous Weekly High | 25.27 |
| Previous Weekly Low | 24.59 |
| Previous Monthly High | 24.53 |
| Previous Monthly Low | 22.11 |
| Daily Fibonacci 38.2% | 24.56 |
| Daily Fibonacci 61.8% | 24.46 |
| Daily Pivot Point S1 | 24.41 |
| Daily Pivot Point S2 | 24.14 |
| Daily Pivot Point S3 | 23.98 |
| Daily Pivot Point R1 | 24.84 |
| Daily Pivot Point R2 | 25.00 |
| Daily Pivot Point R3 | 25.27 |
[/s2If]
Download Nehcap EAWe have two EAs that are operational on our LIVE accounts.
- EA-FIX: Check out the details here. Download EA-FIX . EA-FIX is a non-grid HFT scalper.
- EA-GROWTH: High quality low dd EA using trend grids. Download EA_GROWTHJoin Our Telegram Group
")


