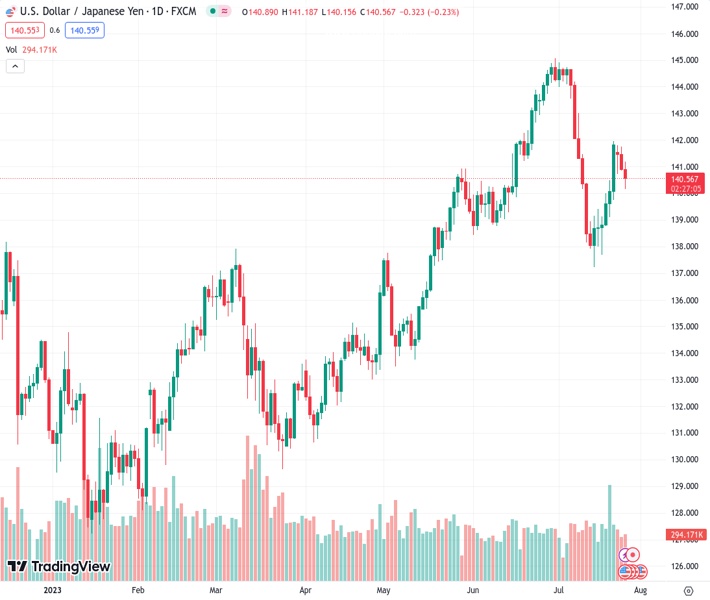
The USDJPY is maintaining its decrease throughout the day, with its value at 140.657 and it remains at a lower level around 140.40.
…
This is a premium post.
[s2If !current_user_can(access_s2member_level4)]Please register for FREE REGISTER to read full post below containing analysis. In case of any error or you think you are not able to read the full post below, please email us at support#nehcap.com [lwa][/s2If] [s2If current_user_can(access_s2member_level1)]
- USD/JPY holds to daily losses at the 140.40 area.
The pair currently trades last at 140.657.
The previous day high was 141.75 while the previous day low was 140.85. The daily 38.2% Fib levels comes at 141.2, expected to provide resistance. Similarly, the daily 61.8% fib level is at 141.41, expected to provide resistance.
Following the Federal Reserve (Fed) decision, the USD DXY index continues to trade weak, near 101.19, and the USD/JPY stands with losses at 140.40.
The Federal Reserve (Fed) announced that it hiked rates by 25 basis points (bps) to the 5.25%-5.50% target, as expected, its highest in 22 years. The statement noted that economic activity and the labour market remain robust and that inflation is elevated. In addition, the Federal Open Market Committee (FOMC) opened the door to further hikes as they will consider monetary policy lags and its implications on economic activity in the next decision.
Following the decision, the US Treasury yields traded mixed. The 2-year yield stands neutral at 4.89%, while the 5- and 10-year rates jumped to 4.16% and 3.90%, both slightly unchanged.
Live Coverage of Chair Powell Press Conference
According to the daily chart, the technical outlook is neutral to bearish. On the positive side, according to the Moving Average Convergence Divergence (MACD), bears are losing ground as it is printing subtle red bars. On the other hand, the Relative Strength Index (RSI) fell below its midline and points south. On the bigger picture, the pair trading above the 100 and 200-day Simple Moving Average (SMA) indicated that the bulls are in command.
Support levels: 139.90, 138.70, 137.30(100-day SMA).
Resistance levels: 141.38 (20-day SMA), 142.00,143.00.
Technical Levels: Supports and Resistances
USDJPY currently trading at 140.54 at the time of writing. Pair opened at 140.91 and is trading with a change of -0.26 % .
| Overview | Overview.1 | |
|---|---|---|
| 0 | Today last price | 140.54 |
| 1 | Today Daily Change | -0.37 |
| 2 | Today Daily Change % | -0.26 |
| 3 | Today daily open | 140.91 |
The pair is trading below its 20 Daily moving average @ 141.6, below its 50 Daily moving average @ 140.83 , above its 100 Daily moving average @ 137.29 and above its 200 Daily moving average @ 136.83
| Trends | Trends.1 | |
|---|---|---|
| 0 | Daily SMA20 | 141.60 |
| 1 | Daily SMA50 | 140.83 |
| 2 | Daily SMA100 | 137.29 |
| 3 | Daily SMA200 | 136.83 |
The previous day high was 141.75 while the previous day low was 140.85. The daily 38.2% Fib levels comes at 141.2, expected to provide resistance. Similarly, the daily 61.8% fib level is at 141.41, expected to provide resistance.
Note the levels of interest below:
- Pivot support is noted at 140.59, 140.28, 139.7
- Pivot resistance is noted at 141.48, 142.06, 142.38
| Levels | Levels.1 |
|---|---|
| Previous Daily High | 141.75 |
| Previous Daily Low | 140.85 |
| Previous Weekly High | 141.96 |
| Previous Weekly Low | 137.68 |
| Previous Monthly High | 145.07 |
| Previous Monthly Low | 138.43 |
| Daily Fibonacci 38.2% | 141.20 |
| Daily Fibonacci 61.8% | 141.41 |
| Daily Pivot Point S1 | 140.59 |
| Daily Pivot Point S2 | 140.28 |
| Daily Pivot Point S3 | 139.70 |
| Daily Pivot Point R1 | 141.48 |
| Daily Pivot Point R2 | 142.06 |
| Daily Pivot Point R3 | 142.38 |
[/s2If]
Download Nehcap EAWe have two EAs that are operational on our LIVE accounts.
- EA-FIX: Check out the details here. Download EA-FIX . EA-FIX is a non-grid HFT scalper.
- EA-GROWTH: High quality low dd EA using trend grids. Download EA_GROWTHJoin Our Telegram Group
")


