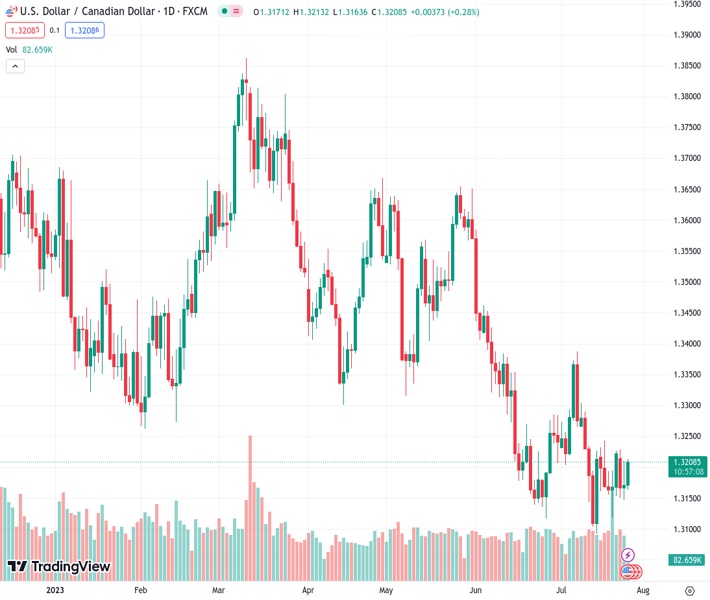
The USDCAD exchange rate of 1.32085 is exhibiting unpredictable and fluctuating movements due to hesitance and wariness in anticipation of the Federal Reserve’s policy decision.
…
This is a premium post.
[s2If !current_user_can(access_s2member_level4)]Please register for FREE REGISTER to read full post below containing analysis. In case of any error or you think you are not able to read the full post below, please email us at support#nehcap.com [lwa][/s2If] [s2If current_user_can(access_s2member_level1)]
- USD/CAD is showing topsy-turvy moves amid caution ahead of Fed policy.
The pair currently trades last at 1.32085.
The previous day high was 1.3209 while the previous day low was 1.3147. The daily 38.2% Fib levels comes at 1.3185, expected to provide support. Similarly, the daily 61.8% fib level is at 1.3171, expected to provide support.
The USD/CAD pair struggles to find direction as investors are awaiting the interest rate decision by the Federal Reserve (Fed) for further guidance. The Loonie asset is demonstrating wild moves in a limited territory as investors are uncertain about guidance for September monetary policy while an interest rate hike of 25 basis points (bps) for the July meet cannot be ruled out.
S&P500 futures look choppy in Europe amid caution ahead of Fed policy. In addition to that, corporate earnings will keep a stock-specific action active. The US Dollar Index (DXY) has corrected sharply to near 101.10 amid a cheerful market mood.
Meanwhile, the Canadian Dollar is expected to pick strength amid upbeat oil prices. Strong discussions about fresh stimulus in China have improved the demand for oil. It is worth noting that Canada is the leading exporter of oil to the United States and higher oil prices support the Canadian Dollar.
USD/CAD is auctioning in a Symmetrical Triangle on an hourly scale, which indicates a volatility contraction. Upward-sloping trendline of the aforementioned chart pattern is plotted from July 20 low at 1.3120 while the downward-sloping trendline is placed from July 18 high at 1.3243.
The 20-period Exponential Moving Average (EMA) at 1.3185 is sticky to the asset, portraying a directionless performance.
Meanwhile, the Relative Strength Index (RSI) (14) is trading in the 40.00-60.00 range, which indicates that investors await a potential trigger for further move.
A solid extension move above July 24 high at 1.3230 would drive the asset toward July 3 high at 1.3273 followed by July 10 high at 1.3304.
On the contrary, a downside move below July 25 low at 1.3147 would expose the asset to July 20 low at 1.3120 and July 14 low at 1.3093.
Technical Levels: Supports and Resistances
USDCAD currently trading at 1.3204 at the time of writing. Pair opened at 1.3172 and is trading with a change of 0.24 % .
| Overview | Overview.1 | |
|---|---|---|
| 0 | Today last price | 1.3204 |
| 1 | Today Daily Change | 0.0032 |
| 2 | Today Daily Change % | 0.2400 |
| 3 | Today daily open | 1.3172 |
The pair remains strongly bearish on the daily time frame. It trades below the 20 SMA @ 1.3222, 50 SMA 1.3321, 100 SMA @ 1.3441 and 200 SMA @ 1.3471.
| Trends | Trends.1 | |
|---|---|---|
| 0 | Daily SMA20 | 1.3222 |
| 1 | Daily SMA50 | 1.3321 |
| 2 | Daily SMA100 | 1.3441 |
| 3 | Daily SMA200 | 1.3471 |
The previous day high was 1.3209 while the previous day low was 1.3147. The daily 38.2% Fib levels comes at 1.3185, expected to provide support. Similarly, the daily 61.8% fib level is at 1.3171, expected to provide support.
Note the levels of interest below:
- Pivot support is noted at 1.3143, 1.3114, 1.308
- Pivot resistance is noted at 1.3205, 1.3238, 1.3268
| Levels | Levels.1 |
|---|---|
| Previous Daily High | 1.3209 |
| Previous Daily Low | 1.3147 |
| Previous Weekly High | 1.3244 |
| Previous Weekly Low | 1.3120 |
| Previous Monthly High | 1.3585 |
| Previous Monthly Low | 1.3117 |
| Daily Fibonacci 38.2% | 1.3185 |
| Daily Fibonacci 61.8% | 1.3171 |
| Daily Pivot Point S1 | 1.3143 |
| Daily Pivot Point S2 | 1.3114 |
| Daily Pivot Point S3 | 1.3080 |
| Daily Pivot Point R1 | 1.3205 |
| Daily Pivot Point R2 | 1.3238 |
| Daily Pivot Point R3 | 1.3268 |
[/s2If]
Download Nehcap EAWe have two EAs that are operational on our LIVE accounts.
- EA-FIX: Check out the details here. Download EA-FIX . EA-FIX is a non-grid HFT scalper.
- EA-GROWTH: High quality low dd EA using trend grids. Download EA_GROWTHJoin Our Telegram Group
")


