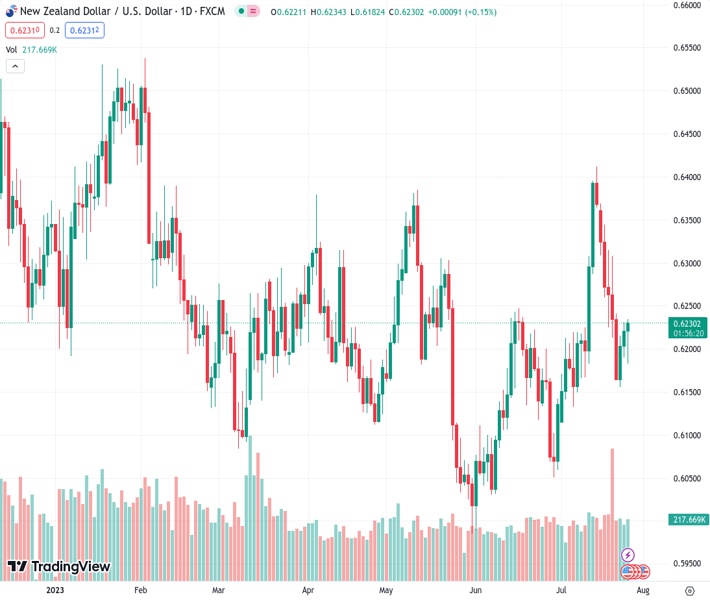
The currency pair NZD/USD, currently valued at 0.62334, experienced an increase and surpassed the level of 0.6200, moving into a favorable zone.
…
This is a premium post.
[s2If !current_user_can(access_s2member_level4)]Please register for FREE REGISTER to read full post below containing analysis. In case of any error or you think you are not able to read the full post below, please email us at support#nehcap.com [lwa][/s2If] [s2If current_user_can(access_s2member_level1)]
- NZD/USD rose above 0.6200 and jumped to positive territory.
The pair currently trades last at 0.62334.
The previous day high was 0.623 while the previous day low was 0.6189. The daily 38.2% Fib levels comes at 0.6214, expected to provide support. Similarly, the daily 61.8% fib level is at 0.6205, expected to provide support.
The NZD/USD cleared daily losses and jumped to positive territory towards the 0.6220 area.
The Federal Reserve (Fed) hiked rates by 25 basis points (bps) to the 5.25-5.50% target. In the presser, Jerome Powell didn’t commit to further hikes noting that ongoing decisions will depend fully on incoming data.
Regarding his economic assessment, he noted that economic activity remains robust, the labour tight, and inflation elevated. In addition, he stated that the Fed expect some “softening” of the labour market and some below-the-trend growth.
During the presser, the US Treasury yields fell sharply, which applied pressure on the USD. The 2-year yield fell to 4.86%, while the 5 and 10-year rates fell to 4.10% and 3.86%, all three with more than 0.50% losses.
According to the daily chart, the outlook is neutral to bearish. The Relative Strength Index (RSI) Index is in positive territory, slightly above the middle line. At the same time, the Moving Average Convergence Divergence (MACD) index prints soft red bars suggesting that the bears are holding their ground. On the bigger picture, the pair holds above the 20,100 and 200-day Simple Moving Averages (SMA), which suggests that the buyers are in command.
Support levels:0.6223 (20-day SMA), 0.62139 (100-day SMA), 0.61978 (200-day SMA).
Resistance levels: 0.6240, 0.6300,0.6350
Technical Levels: Supports and Resistances
NZDUSD currently trading at 0.6229 at the time of writing. Pair opened at 0.6222 and is trading with a change of 0.11 % .
| Overview | Overview.1 | |
|---|---|---|
| 0 | Today last price | 0.6229 |
| 1 | Today Daily Change | 0.0007 |
| 2 | Today Daily Change % | 0.1100 |
| 3 | Today daily open | 0.6222 |
The pair remains strongly bullish on the daily timeframe. It trades above its 20 SMA @ 0.6215, 50 SMA 0.6169, 100 SMA @ 0.6196 and 200 SMA @ 0.6212.
| Trends | Trends.1 | |
|---|---|---|
| 0 | Daily SMA20 | 0.6215 |
| 1 | Daily SMA50 | 0.6169 |
| 2 | Daily SMA100 | 0.6196 |
| 3 | Daily SMA200 | 0.6212 |
The previous day high was 0.623 while the previous day low was 0.6189. The daily 38.2% Fib levels comes at 0.6214, expected to provide support. Similarly, the daily 61.8% fib level is at 0.6205, expected to provide support.
Note the levels of interest below:
- Pivot support is noted at 0.6197, 0.6173, 0.6156
- Pivot resistance is noted at 0.6239, 0.6255, 0.628
| Levels | Levels.1 |
|---|---|
| Previous Daily High | 0.6230 |
| Previous Daily Low | 0.6189 |
| Previous Weekly High | 0.6370 |
| Previous Weekly Low | 0.6163 |
| Previous Monthly High | 0.6250 |
| Previous Monthly Low | 0.5990 |
| Daily Fibonacci 38.2% | 0.6214 |
| Daily Fibonacci 61.8% | 0.6205 |
| Daily Pivot Point S1 | 0.6197 |
| Daily Pivot Point S2 | 0.6173 |
| Daily Pivot Point S3 | 0.6156 |
| Daily Pivot Point R1 | 0.6239 |
| Daily Pivot Point R2 | 0.6255 |
| Daily Pivot Point R3 | 0.6280 |
[/s2If]
Download Nehcap EAWe have two EAs that are operational on our LIVE accounts.
- EA-FIX: Check out the details here. Download EA-FIX . EA-FIX is a non-grid HFT scalper.
- EA-GROWTH: High quality low dd EA using trend grids. Download EA_GROWTHJoin Our Telegram Group
")


