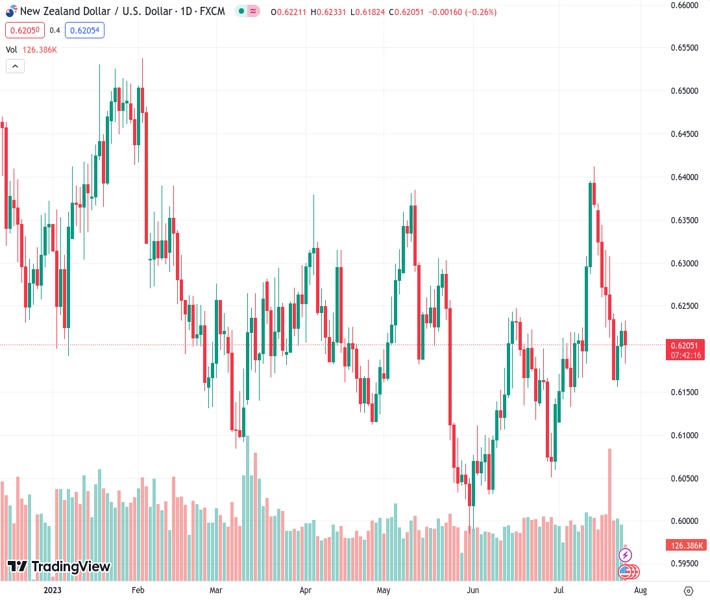
Investors are waiting for guidance from the Federal Reserve on monetary policy, causing selling pressure to be felt around 0.6230 for the NZD/USD pair at a current level of 0.62045.
…
This is a premium post.
[s2If !current_user_can(access_s2member_level4)]Please register for FREE REGISTER to read full post below containing analysis. In case of any error or you think you are not able to read the full post below, please email us at support#nehcap.com [lwa][/s2If] [s2If current_user_can(access_s2member_level1)]
- NZD/USD feels selling pressure around 0.6230 as investors await Fed policy for further guidance.
The pair currently trades last at 0.62045.
The previous day high was 0.623 while the previous day low was 0.6189. The daily 38.2% Fib levels comes at 0.6214, expected to provide resistance. Similarly, the daily 61.8% fib level is at 0.6205, expected to provide resistance.
The NZD/USD pair senses selling pressure while attempting to climb above the immediate resistance of 0.6230 in the early New York session. The Kiwi asset has faced pressure as the US Dollar Index (DXY) has attempted a recovery ahead of the interest rate decision by the Federal Reserve (Fed).
Analysts at Danske Bank expect the Fed to hike interest rates for the final time by 25 bps and then go on hold. While economic activity has still held up well, easing underlying inflation and declining inflation expectations limit the need for further rate hikes. They further expect the immediate market reaction to be muted, with risks skewed towards a hawkish reaction, if Powell still maintains the door open for another hike.
The USD Index has found some support near 101.10 as investors are hoping that Fed Powell will deliver hawkish guidance. S&P500 is expected to open on a negative note, following weak cues from overnight futures.
NZD/USD is trading inside the Ascending Triangle chart pattern on a daily scale, which indicates a sheer contraction in volatility. The horizontal resistance of the aforementioned chart pattern is plotted from May 10 high at 0.6382 while the upward-sloping trendline is placed from May 31 low at 0.5985.
The Kiwi asset is facing resistance near the 200-period Exponential Moving Average (EMA) around 0.6226, which indicates that the long-term trend is bearish.
Meanwhile, the Relative Strength Index (RSI) (14) is oscillating in the 40.00-60.00 range, portraying a lackluster performance.
A decisive breakdown below the round-level support of 0.6200 would drag the asset toward July 26 low at 0.6156. A slippage below the latter would further drag the asset toward June 29 high around 0.6100.
Alternatively, a confident move above July 19 low at 0.6225 would send the major toward July 20 high marginally above 0.6300 followed by July 18 high at 0.6343.
Technical Levels: Supports and Resistances
NZDUSD currently trading at 0.6206 at the time of writing. Pair opened at 0.6222 and is trading with a change of -0.26 % .
| Overview | Overview.1 | |
|---|---|---|
| 0 | Today last price | 0.6206 |
| 1 | Today Daily Change | -0.0016 |
| 2 | Today Daily Change % | -0.2600 |
| 3 | Today daily open | 0.6222 |
The pair is trading below its 20 Daily moving average @ 0.6215, above its 50 Daily moving average @ 0.6169 , above its 100 Daily moving average @ 0.6196 and below its 200 Daily moving average @ 0.6212
| Trends | Trends.1 | |
|---|---|---|
| 0 | Daily SMA20 | 0.6215 |
| 1 | Daily SMA50 | 0.6169 |
| 2 | Daily SMA100 | 0.6196 |
| 3 | Daily SMA200 | 0.6212 |
The previous day high was 0.623 while the previous day low was 0.6189. The daily 38.2% Fib levels comes at 0.6214, expected to provide resistance. Similarly, the daily 61.8% fib level is at 0.6205, expected to provide resistance.
Note the levels of interest below:
- Pivot support is noted at 0.6197, 0.6173, 0.6156
- Pivot resistance is noted at 0.6239, 0.6255, 0.628
| Levels | Levels.1 |
|---|---|
| Previous Daily High | 0.6230 |
| Previous Daily Low | 0.6189 |
| Previous Weekly High | 0.6370 |
| Previous Weekly Low | 0.6163 |
| Previous Monthly High | 0.6250 |
| Previous Monthly Low | 0.5990 |
| Daily Fibonacci 38.2% | 0.6214 |
| Daily Fibonacci 61.8% | 0.6205 |
| Daily Pivot Point S1 | 0.6197 |
| Daily Pivot Point S2 | 0.6173 |
| Daily Pivot Point S3 | 0.6156 |
| Daily Pivot Point R1 | 0.6239 |
| Daily Pivot Point R2 | 0.6255 |
| Daily Pivot Point R3 | 0.6280 |
[/s2If]
Download Nehcap EAWe have two EAs that are operational on our LIVE accounts.
- EA-FIX: Check out the details here. Download EA-FIX . EA-FIX is a non-grid HFT scalper.
- EA-GROWTH: High quality low dd EA using trend grids. Download EA_GROWTHJoin Our Telegram Group
")


