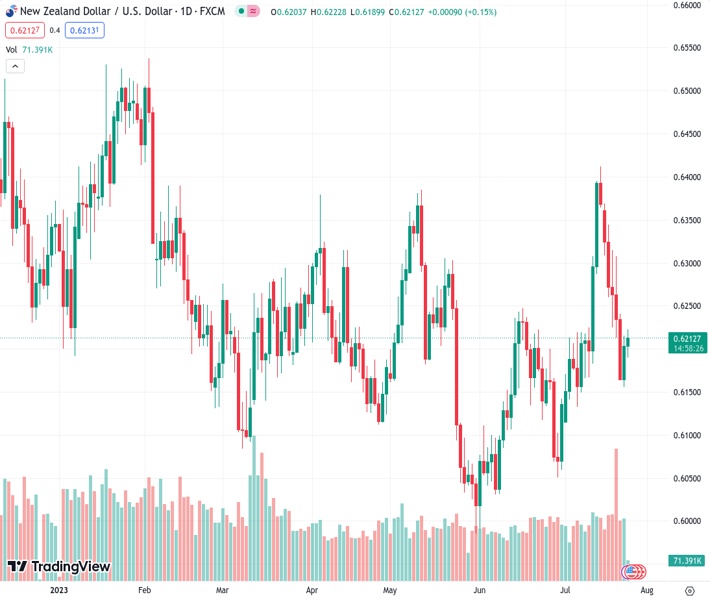
The NZDUSD pair, currently trading at 0.62151, is holding its position after a rebound from a 12-day low. This is supported by an improvement in market sentiment driven by positive developments in China. According to @nehcap, there is an anticipation of more upward movement in the pair.
…
This is a premium post.
[s2If !current_user_can(access_s2member_level4)]Please register for FREE REGISTER to read full post below containing analysis. In case of any error or you think you are not able to read the full post below, please email us at support#nehcap.com [lwa][/s2If] [s2If current_user_can(access_s2member_level1)]
- NZD/USD defends the previous day’s corrective bounce off 12-day-low amid China-inspired risk-on mood.
The pair currently trades last at 0.62151.
The previous day high was 0.6216 while the previous day low was 0.6156. The daily 38.2% Fib levels comes at 0.6193, expected to provide support. Similarly, the daily 61.8% fib level is at 0.6179, expected to provide support.
NZD/USD remains on the front foot for the second consecutive day but lacks upside momentum amid mixed catalysts. That said, the Kiwi pair prints mild gains around 0.6215 heading into Tuesday’s European session.
A clear run-up beyond the 200-Exponential Moving Average (EMA) joins the market’s risk-on mood to propel the Kiwi prices.
Also read: S&P500 Futures struggle to justify optimism in China, Hong Kong amid sluggish yields, pre-Fed anxiety
Adding strength to the NZD/USD upside momentum is the upbeat RSI (14) line, not overbought, as well as the market’s positioning for Wednesday’s Federal Open Market Committee (FOMC) monetary policy meeting announcements.
With this, the NZD/USD buyers are all set to cross a two-week-old descending resistance line, around 0.6225. However, a convergence of the 100-EMA and 50% Fibonacci retracement level, around 0.6230 by the press time, appears a tough nut to crack for the Kiwi bulls afterward.
In a case where the NZD/USD remains firmer past 0.6230, the odds of witnessing a run-up towards a fortnight-old horizontal resistance area surrounding 0.6300-6310 can’t be ruled out.
On the flip side, the 200-EMA level of around 0.6200 restricts the immediate downside of the Kiwi pair.
Following that, an ascending support line from July 06 and 78.6% Fibonacci retracement, respectively near 0.6160 and 0.6125 in that order, will test the NZD/USD bears.
Trend: Further upside expected
Technical Levels: Supports and Resistances
NZDUSD currently trading at 0.6217 at the time of writing. Pair opened at 0.6204 and is trading with a change of 0.21% % .
| Overview | Overview.1 | |
|---|---|---|
| 0 | Today last price | 0.6217 |
| 1 | Today Daily Change | 0.0013 |
| 2 | Today Daily Change % | 0.21% |
| 3 | Today daily open | 0.6204 |
The pair remains strongly bullish on the daily timeframe. It trades above its 20 SMA @ 0.6212, 50 SMA 0.6169, 100 SMA @ 0.6195 and 200 SMA @ 0.6209.
| Trends | Trends.1 | |
|---|---|---|
| 0 | Daily SMA20 | 0.6212 |
| 1 | Daily SMA50 | 0.6169 |
| 2 | Daily SMA100 | 0.6195 |
| 3 | Daily SMA200 | 0.6209 |
The previous day high was 0.6216 while the previous day low was 0.6156. The daily 38.2% Fib levels comes at 0.6193, expected to provide support. Similarly, the daily 61.8% fib level is at 0.6179, expected to provide support.
Note the levels of interest below:
- Pivot support is noted at 0.6168, 0.6132, 0.6108
- Pivot resistance is noted at 0.6228, 0.6252, 0.6288
| Levels | Levels.1 |
|---|---|
| Previous Daily High | 0.6216 |
| Previous Daily Low | 0.6156 |
| Previous Weekly High | 0.6370 |
| Previous Weekly Low | 0.6163 |
| Previous Monthly High | 0.6250 |
| Previous Monthly Low | 0.5990 |
| Daily Fibonacci 38.2% | 0.6193 |
| Daily Fibonacci 61.8% | 0.6179 |
| Daily Pivot Point S1 | 0.6168 |
| Daily Pivot Point S2 | 0.6132 |
| Daily Pivot Point S3 | 0.6108 |
| Daily Pivot Point R1 | 0.6228 |
| Daily Pivot Point R2 | 0.6252 |
| Daily Pivot Point R3 | 0.6288 |
[/s2If]
Download Nehcap EAWe have two EAs that are operational on our LIVE accounts.
- EA-FIX: Check out the details here. Download EA-FIX . EA-FIX is a non-grid HFT scalper.
- EA-GROWTH: High quality low dd EA using trend grids. Download EA_GROWTHJoin Our Telegram Group
")


