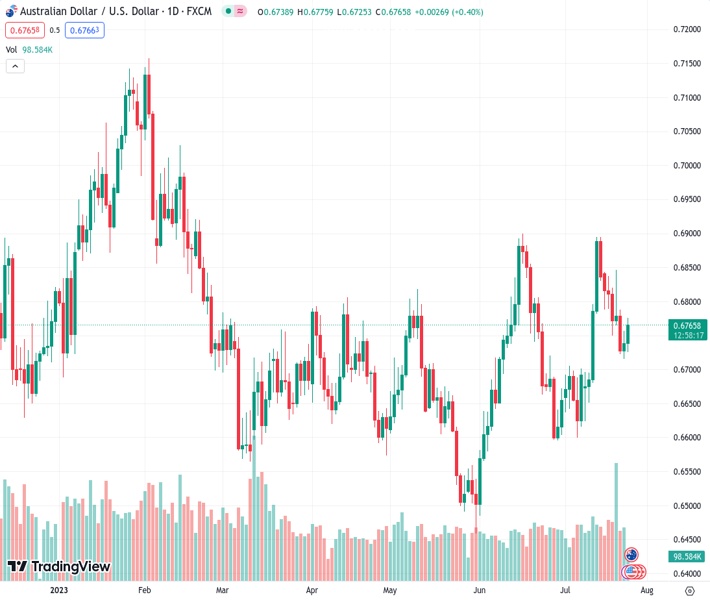
The AUDUSD pair has gained significant upward momentum at a rate of 0.67674, as China’s potential for additional stimulus measures generates optimistic sentiment.
…
This is a premium post.
[s2If !current_user_can(access_s2member_level4)]Please register for FREE REGISTER to read full post below containing analysis. In case of any error or you think you are not able to read the full post below, please email us at support#nehcap.com [lwa][/s2If] [s2If current_user_can(access_s2member_level1)]
- AUD/USD gains strong positive traction in the wake of hopes for more stimulus from China.
The pair currently trades last at 0.67674.
The previous day high was 0.6756 while the previous day low was 0.6715. The daily 38.2% Fib levels comes at 0.674, expected to provide support. Similarly, the daily 61.8% fib level is at 0.6731, expected to provide support.
The AUD/USD pair attracts fresh buying in the vicinity of the 200-day Simple Moving Average (SMA) for the second straight day on Tuesday and builds on its steady intraday ascent through the early European session. Spot prices touched a fresh daily peak, around the 0.6775 region in the last hour and draw support from a combination of factors.
Investors cheered China’s pledge to step up support for its fragile economy, which is evident from a positive risk tone around the equity markets and benefits the risk-sensitive Australian Dollar (AUD). In fact, state news agency Xinhua cited the Politburo – the top decision-making body of the ruling Communist Party – saying that China will step up economic policy adjustments, focusing on expanding domestic demand, boosting confidence and preventing risks. This comes after China’s top economic planner – the National Development and Reform Commission (NDRC) – unveiled measures on Monday to spur private investment in infrastructure and strengthen financing for private projects.
The optimism continues to boost investors’ confidence and prompts some selling around the safe-haven US Dollar (USD), which, in turn, is seen as another factor acting as a tailwind for the AUD/USD pair. The USD Index (DXY), which tracks the Greenback against a basket of currencies, corrects from a two-week high and for now, seems to have stalled a one-week-old recovery trend from its lowest level since April 2022. Any further USD downside, however, seems limited as traders might refrain from placing aggressive bets and prefer to wait for cues about the Federal Reserve’s (Fed) future rate-hike path. Hence, the focus remains on the outcome of the highly-anticipated two-day FOMC policy meeting.
The US central bank is scheduled to announce its decision on Wednesday. The markets have been pricing out the possibility of any further rate hikes after the widely anticipated 25 bps lift-off in July. Investors, however, remain sceptic if the Fed will commit to a more dovish stance, suggesting that investors will closely scrutinize the accompanying policy statement and Fed Chair Jerome Powell’s remarks at the post-meeting press conference. The outlook will play a key role in influencing the near-term USD price dynamics. This makes it prudent to wait for some follow-through buying before confirming that the AUD/USD pair’s rejection slide from the 0.6900 mark has run its course.
Market participants now look to the US macro data – the Conference Board’s Consumer Confidence Index and Richmond Fed Manufacturing Index – for some impetus later during the early North American session. Apart from this, the broader risk sentiment might produce short-term trading opportunities around the AUD/USD pair ahead of the Australian Consumer inflation figures, due for release during the Asian session on Wednesday. This week’s US economic docket also features the release of Advance US GDP print and the Core PCE Price Index (the Fed’s preferred inflation gauge), which should further contribute to infusing volatility in the markets and drive spot prices.
Technical Levels: Supports and Resistances
AUDUSD currently trading at 0.677 at the time of writing. Pair opened at 0.6739 and is trading with a change of 0.46 % .
| Overview | Overview.1 | |
|---|---|---|
| 0 | Today last price | 0.6770 |
| 1 | Today Daily Change | 0.0031 |
| 2 | Today Daily Change % | 0.4600 |
| 3 | Today daily open | 0.6739 |
The pair remains strongly bullish on the daily timeframe. It trades above its 20 SMA @ 0.6721, 50 SMA 0.6692, 100 SMA @ 0.6687 and 200 SMA @ 0.672.
| Trends | Trends.1 | |
|---|---|---|
| 0 | Daily SMA20 | 0.6721 |
| 1 | Daily SMA50 | 0.6692 |
| 2 | Daily SMA100 | 0.6687 |
| 3 | Daily SMA200 | 0.6720 |
The previous day high was 0.6756 while the previous day low was 0.6715. The daily 38.2% Fib levels comes at 0.674, expected to provide support. Similarly, the daily 61.8% fib level is at 0.6731, expected to provide support.
Note the levels of interest below:
- Pivot support is noted at 0.6718, 0.6696, 0.6676
- Pivot resistance is noted at 0.6759, 0.6778, 0.68
| Levels | Levels.1 |
|---|---|
| Previous Daily High | 0.6756 |
| Previous Daily Low | 0.6715 |
| Previous Weekly High | 0.6854 |
| Previous Weekly Low | 0.6722 |
| Previous Monthly High | 0.6900 |
| Previous Monthly Low | 0.6484 |
| Daily Fibonacci 38.2% | 0.6740 |
| Daily Fibonacci 61.8% | 0.6731 |
| Daily Pivot Point S1 | 0.6718 |
| Daily Pivot Point S2 | 0.6696 |
| Daily Pivot Point S3 | 0.6676 |
| Daily Pivot Point R1 | 0.6759 |
| Daily Pivot Point R2 | 0.6778 |
| Daily Pivot Point R3 | 0.6800 |
[/s2If]
Download Nehcap EAWe have two EAs that are operational on our LIVE accounts.
- EA-FIX: Check out the details here. Download EA-FIX . EA-FIX is a non-grid HFT scalper.
- EA-GROWTH: High quality low dd EA using trend grids. Download EA_GROWTHJoin Our Telegram Group
")


