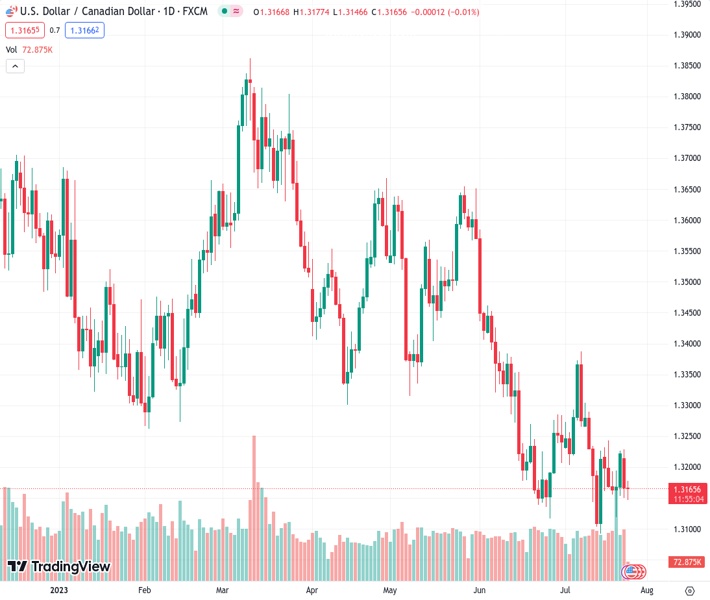
During the early European session on Tuesday, the USDCAD pair fluctuates within a small range of trading around the price level of 1.31636.
…
This is a premium post.
[s2If !current_user_can(access_s2member_level4)]Please register for FREE REGISTER to read full post below containing analysis. In case of any error or you think you are not able to read the full post below, please email us at support#nehcap.com [lwa][/s2If] [s2If current_user_can(access_s2member_level1)]
- USD/CAD oscillates in a narrow trading band through the early European session on Tuesday.
The pair currently trades last at 1.31636.
The previous day high was 1.3229 while the previous day low was 1.315. The daily 38.2% Fib levels comes at 1.318, expected to provide resistance. Similarly, the daily 61.8% fib level is at 1.3199, expected to provide resistance.
The USD/CAD pair struggles for a firm intraday direction and seesaws between tepid gains/minor losses through the early part of the European session on Tuesday. Spot prices currently trade just above mid-1.3100s, nearly unchanged for the day, though the fundamental backdrop favours bearish traders and suggests that the path of least resistance is to the upside.
A modest pullback in Crude Oil prices from over a three-month high touched on Monday undermines the commodity-linked Loonie and turns out to be a key factor acting as a tailwind for the USD/CAD pair. That said, hopes that additional stimulus measures from China will boost fuel demand, along with tighter global supplies, should continue to lend support to the black liquid. Apart from this, the emergence of some US Dollar (USD) selling might further contribute to limiting the upside for the major, at least for the time being.
In fact, the USD Index (DXY), which tracks the Greenback against a basket of currencies, retreats from a two-week high and for now, seems to have stalled its recent recovery move from the lowest level since April 2022 touched last week. The markets seem convinced that the Federal Reserve (Fed) is nearing the end of its current policy tightening. This, along with a generally positive tone around the equity markets, prompts some profit-taking around the safe-haven buck ahead of the two-day FOMC policy meeting starting this Tuesday.
The Fed is scheduled to announce its decision on Wednesday and is widely expected to hike interest rates by 25 bps. Investors, meanwhile, remain sceptic if the US central bank will commit to a more dovish stance or stick to its forecast for a 50 bps lift-off by the end of this year. Hence, the focus will remain glued to the accompanying policy statement and Fed Chair Jerome Powell’s comments at the post-meeting press conference, which will be scrutinized for cues about the future rate-hike path and drive the USD demand in the near term.
In the meantime, traders on Tuesday will look to the US macro data – the Conference Board’s Consumer Confidence Index and Richmond Fed Manufacturing Index – for some impetus later during the early North American session. This, along with the broader risk sentiment, will influence the USD. Apart from this, Oil price dynamics should produce short-term trading opportunities around the USD/CAD pair.
Technical Levels: Supports and Resistances
USDCAD currently trading at 1.3166 at the time of writing. Pair opened at 1.3168 and is trading with a change of -0.02 % .
| Overview | Overview.1 | |
|---|---|---|
| 0 | Today last price | 1.3166 |
| 1 | Today Daily Change | -0.0002 |
| 2 | Today Daily Change % | -0.0200 |
| 3 | Today daily open | 1.3168 |
The pair remains strongly bearish on the daily time frame. It trades below the 20 SMA @ 1.3223, 50 SMA 1.3327, 100 SMA @ 1.3447 and 200 SMA @ 1.3474.
| Trends | Trends.1 | |
|---|---|---|
| 0 | Daily SMA20 | 1.3223 |
| 1 | Daily SMA50 | 1.3327 |
| 2 | Daily SMA100 | 1.3447 |
| 3 | Daily SMA200 | 1.3474 |
The previous day high was 1.3229 while the previous day low was 1.315. The daily 38.2% Fib levels comes at 1.318, expected to provide resistance. Similarly, the daily 61.8% fib level is at 1.3199, expected to provide resistance.
Note the levels of interest below:
- Pivot support is noted at 1.3136, 1.3104, 1.3057
- Pivot resistance is noted at 1.3214, 1.3261, 1.3293
| Levels | Levels.1 |
|---|---|
| Previous Daily High | 1.3229 |
| Previous Daily Low | 1.3150 |
| Previous Weekly High | 1.3244 |
| Previous Weekly Low | 1.3120 |
| Previous Monthly High | 1.3585 |
| Previous Monthly Low | 1.3117 |
| Daily Fibonacci 38.2% | 1.3180 |
| Daily Fibonacci 61.8% | 1.3199 |
| Daily Pivot Point S1 | 1.3136 |
| Daily Pivot Point S2 | 1.3104 |
| Daily Pivot Point S3 | 1.3057 |
| Daily Pivot Point R1 | 1.3214 |
| Daily Pivot Point R2 | 1.3261 |
| Daily Pivot Point R3 | 1.3293 |
[/s2If]
Download Nehcap EAWe have two EAs that are operational on our LIVE accounts.
- EA-FIX: Check out the details here. Download EA-FIX . EA-FIX is a non-grid HFT scalper.
- EA-GROWTH: High quality low dd EA using trend grids. Download EA_GROWTHJoin Our Telegram Group
")


