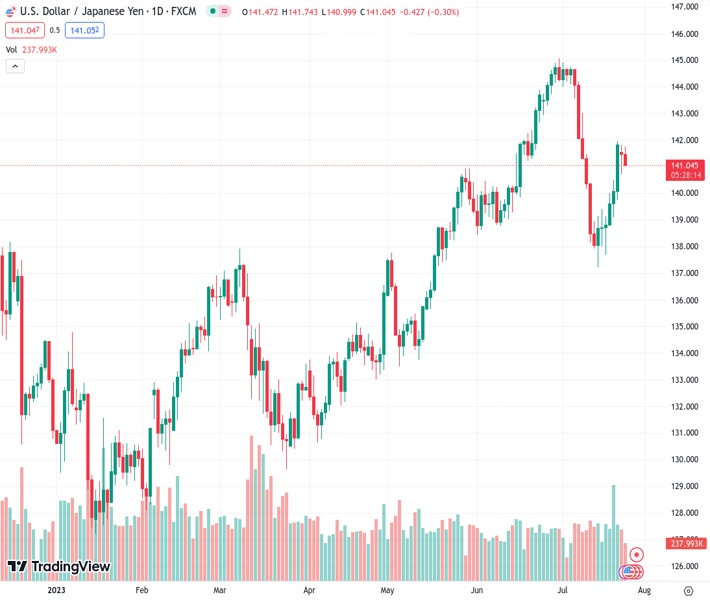
Despite the increase in US Treasury bond yields and the growing market confidence before the Fed’s decision, the USDJPY at 141.031 experiences a retreat.
…
This is a premium post.
[s2If !current_user_can(access_s2member_level4)]Please register for FREE REGISTER to read full post below containing analysis. In case of any error or you think you are not able to read the full post below, please email us at support#nehcap.com [lwa][/s2If] [s2If current_user_can(access_s2member_level1)]
- USD/JPY retreats despite the rise in US Treasury bond yields and growing market confidence ahead of the Fed’s decision.
The pair currently trades last at 141.031.
The previous day high was 141.82 while the previous day low was 140.74. The daily 38.2% Fib levels comes at 141.15, expected to provide resistance. Similarly, the daily 61.8% fib level is at 141.41, expected to provide resistance.
USD/JPY retreats from weekly highs of 141.81 and falls toward current exchange rates amid a risk-on impulse, although US Treasury bond yields are rising. Traders brace for the US Federal Reserve (Fed) July meeting, which starts today and ends tomorrow, followed by the Fed Chair Jerome Powell press conference. At the time of writing, the USD/JPY exchanges hand at 141.05.
Wall Street is trading with gains ahead of the Fed’s decision on Wednesday. The Conference Board (CB) latest US Consumer Confidence report rose to a two-year high in July, jumping to 117 from 110.1 in June and exceeding estimates of 111.8. Even though the news was positive, consumers’ perceptions about a possible recession over the next 12 months ticked up.
Other data witnessed the House Price Index for May in year-over-year figures (YoY) standing at 2.8%, above estimates of 2.6% but below the prior’s month data, while the Richmond Fed Manufacturing Index further deteriorated from -8 in June to -9.
The USD/JPY lost traction of the US 10-year Treasury note yield, up two basis points at 3.900%, while the major dropped some 0.28%. At the same time, the US Dollar Index (DXY), a measure of the greenback’s performance against a basket of peers, clings to 0.05% gains at 101.431.
On the Japanese front, the Cabinet Office updated its projections, which according to Brown Brothers Harriman (BBH) analyst Win Thin, are expected to be aligned with the Bank of Japan’s (BoJ) forecasts. Inflation is seen at around 0.7% from 2027 to 2032 as the baseline scenario, while for 2023 is estimated at 2.6% and 1.9% in 2024. Regarding economic growth, the office sees a 1.3% GDP growth in 2023 and 1.2% in 2024.
The USD/JPY daily chart shows the uptrend remains in play, but the ongoing pullback extending below the Kijun-Sen line at 141.15, could open the door for further weakness below the 141,00 figure. Next floor would be an upslope support trendline drawn from March lows of 129.64, at around 140.60/50, followed by the confluence of the Senkou Span A/B at around 140.37/35, followed by the Tenkan-Sen line at 139.59. On the other hand, to flip the trend and resume upwards, USD/JPY must reclaim 142.00, opening the door for further upside toward the year-to-date (YTD) high at 145.07.
Technical Levels: Supports and Resistances
USDJPY currently trading at 141.01 at the time of writing. Pair opened at 141.48 and is trading with a change of -0.33 % .
| Overview | Overview.1 | |
|---|---|---|
| 0 | Today last price | 141.01 |
| 1 | Today Daily Change | -0.47 |
| 2 | Today Daily Change % | -0.33 |
| 3 | Today daily open | 141.48 |
The pair is trading below its 20 Daily moving average @ 141.76, above its 50 Daily moving average @ 140.74 , above its 100 Daily moving average @ 137.25 and above its 200 Daily moving average @ 136.88
| Trends | Trends.1 | |
|---|---|---|
| 0 | Daily SMA20 | 141.76 |
| 1 | Daily SMA50 | 140.74 |
| 2 | Daily SMA100 | 137.25 |
| 3 | Daily SMA200 | 136.88 |
The previous day high was 141.82 while the previous day low was 140.74. The daily 38.2% Fib levels comes at 141.15, expected to provide resistance. Similarly, the daily 61.8% fib level is at 141.41, expected to provide resistance.
Note the levels of interest below:
- Pivot support is noted at 140.88, 140.27, 139.8
- Pivot resistance is noted at 141.95, 142.42, 143.02
| Levels | Levels.1 |
|---|---|
| Previous Daily High | 141.82 |
| Previous Daily Low | 140.74 |
| Previous Weekly High | 141.96 |
| Previous Weekly Low | 137.68 |
| Previous Monthly High | 145.07 |
| Previous Monthly Low | 138.43 |
| Daily Fibonacci 38.2% | 141.15 |
| Daily Fibonacci 61.8% | 141.41 |
| Daily Pivot Point S1 | 140.88 |
| Daily Pivot Point S2 | 140.27 |
| Daily Pivot Point S3 | 139.80 |
| Daily Pivot Point R1 | 141.95 |
| Daily Pivot Point R2 | 142.42 |
| Daily Pivot Point R3 | 143.02 |
[/s2If]
Download Nehcap EAWe have two EAs that are operational on our LIVE accounts.
- EA-FIX: Check out the details here. Download EA-FIX . EA-FIX is a non-grid HFT scalper.
- EA-GROWTH: High quality low dd EA using trend grids. Download EA_GROWTHJoin Our Telegram Group
")


