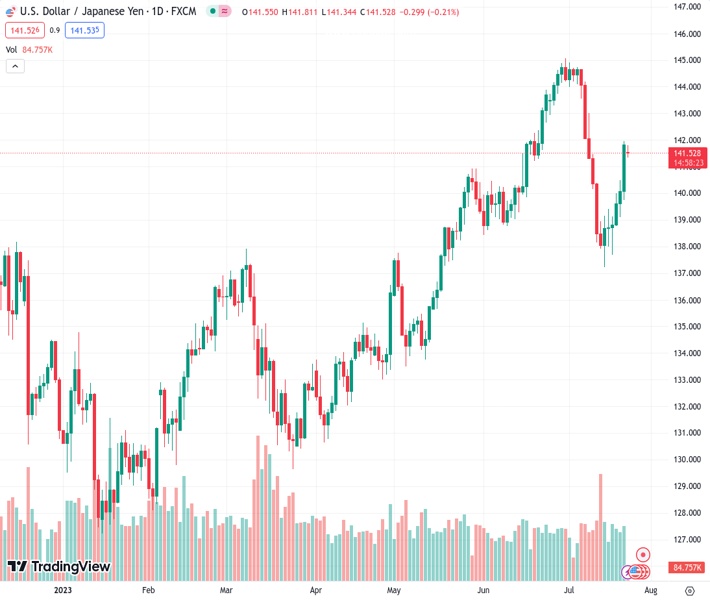
The USDJPY pair remains stable above 141.50 as it consolidates its recent advances, preparing for the start of the European session.
…
This is a premium post.
[s2If !current_user_can(access_s2member_level4)]Please register for FREE REGISTER to read full post below containing analysis. In case of any error or you think you are not able to read the full post below, please email us at support#nehcap.com [lwa][/s2If] [s2If current_user_can(access_s2member_level1)]
- USD/JPY consolidates its recent gains above the 141.50 mark heading into the European session.
The pair currently trades last at 141.558.
The previous day high was 141.96 while the previous day low was 139.75. The daily 38.2% Fib levels comes at 141.11, expected to provide support. Similarly, the daily 61.8% fib level is at 140.59, expected to provide support.
The USD/JPY pair consolidates its recent gains heading into the European session on Monday. Market players prefer to wait to be sidelined ahead of the Federal Reserve’s (Fed) and Bank of Japan’s (BoJ) monetary policy decisions. The major pair currently trades near 141.50, down 0.22% on the day.
USD/JPY has edged higher after Reuters reported that the BoJ will likely maintain the easy-money and yield control policies in the July meeting. On the other hand, the Fed will announce its monetary policy decision on Wednesday. The market expected a 25 basis point (bps) rate hike. This, in turn, led to the weakening of the Japanese Yen against its major rivals due to monetary policy divergences between the BoJ and Fed.
According to the one-hour chart, Any meaningful follow-through buying beyond 141.65 could pave the way to the next hurdle at the 141.95–142.00 zone, highlighting a psychological round mark and the upper boundary of the Bollinger Band. The additional upside filter to watch is 142.10 (Low of July 7), followed by the 143.00 area (a psychological round mark, High of July 10). The next barrier to watch is at 143.55 (High of July 10).
On the flip side, a break below 141.35 would expose to 140.85, portraying the 50-hour Exponential Moving Average (EMA) en route to 140.30 (100-hour EMA) and finally 140.00, a confluence of a psychological round figure and a high of July 19.
It’s worth noting that the Relative Strength Index (RSI) stands above 50, indicating further upside cannot be ruled out.
Technical Levels: Supports and Resistances
USDJPY currently trading at 141.51 at the time of writing. Pair opened at 141.82 and is trading with a change of -0.22 % .
| Overview | Overview.1 | |
|---|---|---|
| 0 | Today last price | 141.51 |
| 1 | Today Daily Change | -0.31 |
| 2 | Today Daily Change % | -0.22 |
| 3 | Today daily open | 141.82 |
The pair is trading below its 20 Daily moving average @ 141.86, above its 50 Daily moving average @ 140.63 , above its 100 Daily moving average @ 137.2 and above its 200 Daily moving average @ 136.91
| Trends | Trends.1 | |
|---|---|---|
| 0 | Daily SMA20 | 141.86 |
| 1 | Daily SMA50 | 140.63 |
| 2 | Daily SMA100 | 137.20 |
| 3 | Daily SMA200 | 136.91 |
The previous day high was 141.96 while the previous day low was 139.75. The daily 38.2% Fib levels comes at 141.11, expected to provide support. Similarly, the daily 61.8% fib level is at 140.59, expected to provide support.
Note the levels of interest below:
- Pivot support is noted at 140.39, 138.97, 138.18
- Pivot resistance is noted at 142.6, 143.38, 144.81
| Levels | Levels.1 |
|---|---|
| Previous Daily High | 141.96 |
| Previous Daily Low | 139.75 |
| Previous Weekly High | 141.96 |
| Previous Weekly Low | 137.68 |
| Previous Monthly High | 145.07 |
| Previous Monthly Low | 138.43 |
| Daily Fibonacci 38.2% | 141.11 |
| Daily Fibonacci 61.8% | 140.59 |
| Daily Pivot Point S1 | 140.39 |
| Daily Pivot Point S2 | 138.97 |
| Daily Pivot Point S3 | 138.18 |
| Daily Pivot Point R1 | 142.60 |
| Daily Pivot Point R2 | 143.38 |
| Daily Pivot Point R3 | 144.81 |
[/s2If]
Download Nehcap EAWe have two EAs that are operational on our LIVE accounts.
- EA-FIX: Check out the details here. Download EA-FIX . EA-FIX is a non-grid HFT scalper.
- EA-GROWTH: High quality low dd EA using trend grids. Download EA_GROWTHJoin Our Telegram Group
")


