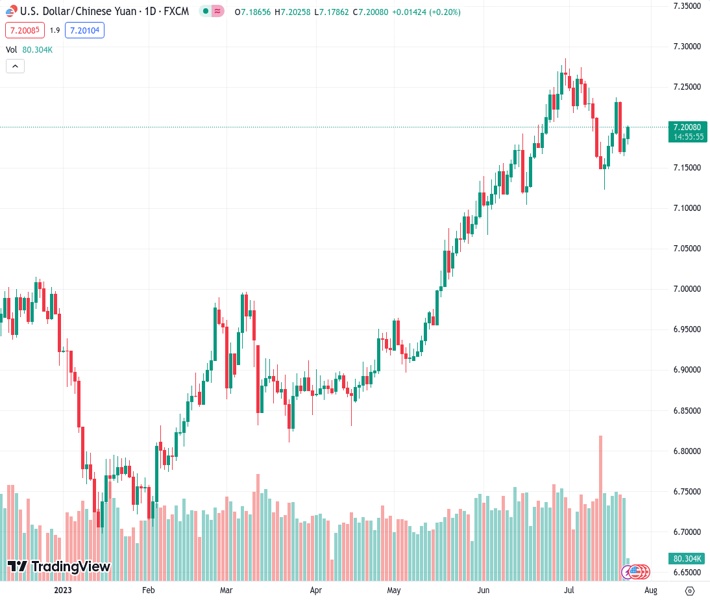
The USDCNH has been supported by bullish activity above the 200-day simple moving average (SMA) for two consecutive days, although gains have been modest recently. According to the viewpoint of Nehcap, there is an anticipation for limited upward potential.
…
This is a premium post.
[s2If !current_user_can(access_s2member_level4)]Please register for FREE REGISTER to read full post below containing analysis. In case of any error or you think you are not able to read the full post below, please email us at support#nehcap.com [lwa][/s2If] [s2If current_user_can(access_s2member_level1)]
- USD/CNH bulls prod 200-SMA during two-day winning streak, clings to mild gains of late.
The pair currently trades last at 7.20048.
The previous day high was 7.1922 while the previous day low was 7.164. The daily 38.2% Fib levels comes at 7.1815, expected to provide support. Similarly, the daily 61.8% fib level is at 7.1748, expected to provide support.
USD/CNH struggles to defend buyers around 7.1980 heading into Monday’s European session, jostling with the 200-SMA of late. In doing so, the offshore Chinese Yuan (CNH) justifies the looming bull cross on the MACD indicator by staying beyond a fortnight-old rising support line.
It’s worth noting that the 38.2% Fibonacci retracement of June 02-30 upside, near 7.2020, will act as an extra upside filter ahead of directing the USD/CNH buyers toward the key resistance line stretched from June 30, close to 7.2270.
In a case where the Chinese Yuan remains weak past 7.2270, the odds of witnessing its slump toward the yearly bottom marked in June surrounding 7.2860 can’t be ruled out.
On the other hand, a convergence of the 50% Fibonacci retracement and an upward-sloping support line from July 14 restricts the immediate downside of the USD/CNH pair near 7.1760.
Following that, the 61.8% Fibonacci retracement, also known as the golden Fibonacci ratio, can challenge the offshore Yuan price near 7.1500.
Should the USD/CNH bears keep the reins past 7.1500, a five-week-old rising support line close to 7.1380 will act as the last defense of the buyers.
Overall, the USD/CNH remains on the bull’s radar even if the 200-SMA challenges the pair’s immediate upside.
Trend: Limited upside expected
Technical Levels: Supports and Resistances
USDCNH currently trading at 7.1986 at the time of writing. Pair opened at 7.1874 and is trading with a change of 0.16% % .
| Overview | Overview.1 | |
|---|---|---|
| 0 | Today last price | 7.1986 |
| 1 | Today Daily Change | 0.0112 |
| 2 | Today Daily Change % | 0.16% |
| 3 | Today daily open | 7.1874 |
The pair is trading below its 20 Daily moving average @ 7.2178, above its 50 Daily moving average @ 7.1521 , above its 100 Daily moving average @ 7.0282 and above its 200 Daily moving average @ 7.0066
| Trends | Trends.1 | |
|---|---|---|
| 0 | Daily SMA20 | 7.2178 |
| 1 | Daily SMA50 | 7.1521 |
| 2 | Daily SMA100 | 7.0282 |
| 3 | Daily SMA200 | 7.0066 |
The previous day high was 7.1922 while the previous day low was 7.164. The daily 38.2% Fib levels comes at 7.1815, expected to provide support. Similarly, the daily 61.8% fib level is at 7.1748, expected to provide support.
Note the levels of interest below:
- Pivot support is noted at 7.1702, 7.153, 7.142
- Pivot resistance is noted at 7.1984, 7.2094, 7.2266
| Levels | Levels.1 |
|---|---|
| Previous Daily High | 7.1922 |
| Previous Daily Low | 7.1640 |
| Previous Weekly High | 7.2368 |
| Previous Weekly Low | 7.1484 |
| Previous Monthly High | 7.2856 |
| Previous Monthly Low | 7.0668 |
| Daily Fibonacci 38.2% | 7.1815 |
| Daily Fibonacci 61.8% | 7.1748 |
| Daily Pivot Point S1 | 7.1702 |
| Daily Pivot Point S2 | 7.1530 |
| Daily Pivot Point S3 | 7.1420 |
| Daily Pivot Point R1 | 7.1984 |
| Daily Pivot Point R2 | 7.2094 |
| Daily Pivot Point R3 | 7.2266 |
[/s2If]
Download Nehcap EAWe have two EAs that are operational on our LIVE accounts.
- EA-FIX: Check out the details here. Download EA-FIX . EA-FIX is a non-grid HFT scalper.
- EA-GROWTH: High quality low dd EA using trend grids. Download EA_GROWTHJoin Our Telegram Group
")


