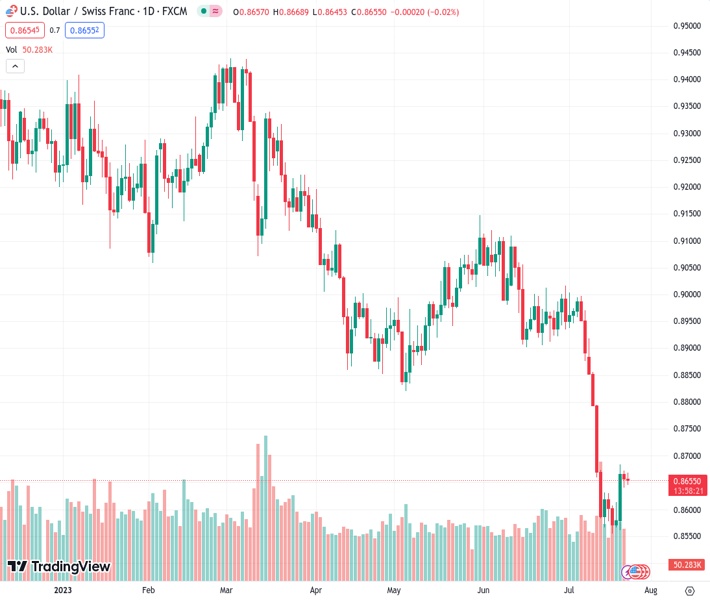
The currency pair USDCHF, which is currently at 0.86600, is trading close to its highest level of the day. However, it has retraced from the one-week high it reached on Friday.
…
This is a premium post.
[s2If !current_user_can(access_s2member_level4)]Please register for FREE REGISTER to read full post below containing analysis. In case of any error or you think you are not able to read the full post below, please email us at support#nehcap.com [lwa][/s2If] [s2If current_user_can(access_s2member_level1)]
- USD/CHF grinds near intraday high, reverses Friday’s U-turn from one-week high.
The pair currently trades last at 0.86600.
The previous day high was 0.8672 while the previous day low was 0.8641. The daily 38.2% Fib levels comes at 0.8653, expected to provide support. Similarly, the daily 61.8% fib level is at 0.866, expected to provide resistance.
USD/CHF clings to mild gains around 0.8665 as markets brace for the top-tier data/events during early Monday in Europe. That said, the Swiss Franc (CHF) pair rose for the first time in four weeks, bouncing off the lowest levels since late 2015, as the US Dollar cheered upbeat data to challenge the dovish Fed bias. However, the recently bearish US Dollar bias of the asset managers and anxiety ahead of today’s preliminary readings of the US S&P Global PMIs for July challenge the pair buyers of late.
That said, Bloomberg quotes the US Commodity Futures Trading Commission (CFTC) data for the week ended on July 18 to state that asset managers boosted bearish dollar bets to a record 18% amid speculation slowing US inflation will hasten the end of the Federal Reserve’s 16-month run of policy tightening.
It should be noted that the US Dollar Index (DXY) flirts with the intraday low near 101.00 as it retreats from the highest level in eight days while portraying the market’s cautious mood. With this, the greenback’s gauge versus six major currencies prints the first daily loss in five, after reversing from the lowest levels since April 2022 in the last week.
In the last week, the US housing numbers and regional manufacturing indices were mostly downbeat but an improvement in the Retail Sales Control Group for June defended the Fed hawks, as well as the US Dollar buyers. On the same line were the previously released upbeat prints of the University of Michigan’s (UoM) Consumer Sentiment Index and consumer inflation expectations for July. Though the US Consumer Price Index (CPI) and Producer Price Index (PPI) for June joined the first below-expectations Nonfarm Payrolls (NFP) in 15 months to tease the Federal Reserve’s (Fed) policy pivot past July and challenge the US Dollar bulls.
Hence, the USD/CHF pair traders will not only pay attention to today’s US PMIs but will also closely observe the first readings of the US second-quarter (Q2) 2023 Gross Domestic Product (GDP) and Fed Chair Jerome Powell’s ability to defend the hawks for clear directions. At home, Wednesday’s Swiss ZEW Survey – Expectations and Friday’s KOF Leading Indicator for July can entertain the Swiss Franc pair traders.
The first daily closing beyond the 10-DMA in two weeks keeps USD/CHF buyers hopeful unless the drops back below the DMA resistance-turned-support of 0.8642.
Technical Levels: Supports and Resistances
USDCHF currently trading at 0.8664 at the time of writing. Pair opened at 0.8656 and is trading with a change of 0.09% % .
| Overview | Overview.1 | |
|---|---|---|
| 0 | Today last price | 0.8664 |
| 1 | Today Daily Change | 0.0008 |
| 2 | Today Daily Change % | 0.09% |
| 3 | Today daily open | 0.8656 |
The pair remains strongly bearish on the daily time frame. It trades below the 20 SMA @ 0.881, 50 SMA 0.8934, 100 SMA @ 0.9002 and 200 SMA @ 0.9218.
| Trends | Trends.1 | |
|---|---|---|
| 0 | Daily SMA20 | 0.8810 |
| 1 | Daily SMA50 | 0.8934 |
| 2 | Daily SMA100 | 0.9002 |
| 3 | Daily SMA200 | 0.9218 |
The previous day high was 0.8672 while the previous day low was 0.8641. The daily 38.2% Fib levels comes at 0.8653, expected to provide support. Similarly, the daily 61.8% fib level is at 0.866, expected to provide resistance.
Note the levels of interest below:
- Pivot support is noted at 0.864, 0.8625, 0.8609
- Pivot resistance is noted at 0.8672, 0.8688, 0.8704
| Levels | Levels.1 |
|---|---|
| Previous Daily High | 0.8672 |
| Previous Daily Low | 0.8641 |
| Previous Weekly High | 0.8684 |
| Previous Weekly Low | 0.8555 |
| Previous Monthly High | 0.9120 |
| Previous Monthly Low | 0.8902 |
| Daily Fibonacci 38.2% | 0.8653 |
| Daily Fibonacci 61.8% | 0.8660 |
| Daily Pivot Point S1 | 0.8640 |
| Daily Pivot Point S2 | 0.8625 |
| Daily Pivot Point S3 | 0.8609 |
| Daily Pivot Point R1 | 0.8672 |
| Daily Pivot Point R2 | 0.8688 |
| Daily Pivot Point R3 | 0.8704 |
[/s2If]
Download Nehcap EAWe have two EAs that are operational on our LIVE accounts.
- EA-FIX: Check out the details here. Download EA-FIX . EA-FIX is a non-grid HFT scalper.
- EA-GROWTH: High quality low dd EA using trend grids. Download EA_GROWTHJoin Our Telegram Group
")


