On Monday, the exchange rate between the euro and the Japanese yen at 157.321 faces some selling pressure due to a moderate strengthening of the yen.
…
This is a premium post.
[s2If !current_user_can(access_s2member_level4)]Please register for FREE REGISTER to read full post below containing analysis. In case of any error or you think you are not able to read the full post below, please email us at support#nehcap.com [lwa][/s2If] [s2If current_user_can(access_s2member_level1)]
- EUR/JPY meets with some supply on Monday and is pressured by a modest JPY strength.
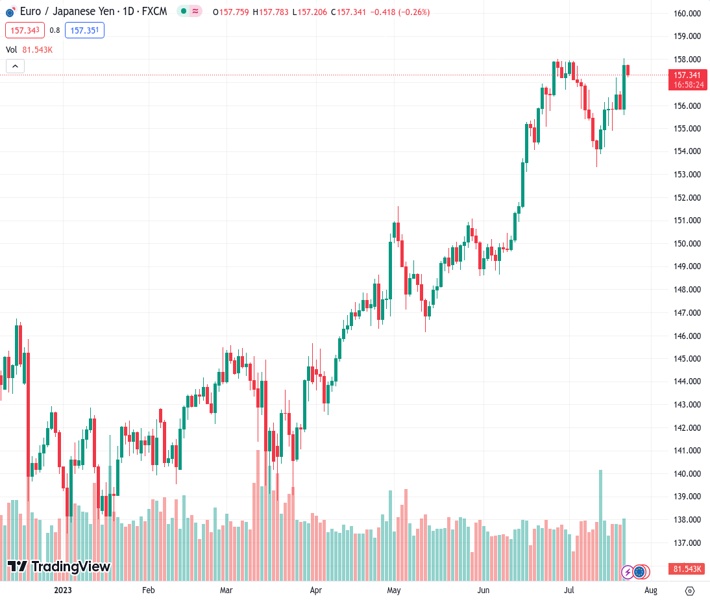
The pair currently trades last at 157.321.
The previous day high was 158.05 while the previous day low was 155.59. The daily 38.2% Fib levels comes at 157.11, expected to provide support. Similarly, the daily 61.8% fib level is at 156.53, expected to provide support.
The EUR/JPY cross edges lower on the first day of a new week and reverses a part of Friday’s strong move up to the 158.00 mark, or its highest level since September 2008. Spot prices remain on the defensive through the Asian session and currently trade around the 157.30-157.35 region, down just over 0.25% for the day.
The Japanese Yen (JPY) strengthens a bit in reaction to comments by Japan’s top currency diplomat Masato Kanda, saying that the recent inflation and wage rises were overshooting expectations. This revives hopes that the Bank of Japan (BoJ) might tweak its Yield Curve Control (YCC) policy later this week, which, along with a softer risk tone, underpins the safe-haven JPY and exerts some pressure on the EUR/JPY cross.
The shared currency, on the other hand, is undermined by the fact that European Central Bank (ECB) officials recently delivered mixed signals regarding the next policy move after the anticipated 25 bps lift-off this week. This is seen as another factor weighing on the EUR/JPY cross, though the downside seems limited ahead of the key central bank event risks – the ECB and BoJ decisions on Thursday and Friday, respectively.
From a technical perspective, Friday’s sustained break through the 157.00 mark was seen as a fresh trigger for bullish traders. That said, failure near the 158.00 rond figure, which has been acting as a stiff resistance since late June, along with the occurrence of a negative Relative Strength Index (RSI) divergence on the daily chart, warrant cation before positioning for any further near-term appreciating move for the EUR/JPY cross.
This makes it prudent to wait for some follow-through buying and acceptance above the 158.00 mark before placing fresh bullish bets around the EUR/JPY cross. Spot prices might then surpass an intermediate hurdle near the 158.30-158.35 region and aim to reclaim the 159.00 round figure before eventually climbing to the next relevant resistance near the 159.40-159.50 area.
On the flip side, the 157.00 resistance breakpoint now seems to protect the immediate downside ahead of the 156.25 region and the 156.00 handle. This is followed by support near the 155.70 area, below which the EUR/JPY cross could accelerate the fall towards challenging the 155.00 psychological mark. The corrective decline could get extended further towards the 154.00 mark en route to the monthly low around the 153.35 region.
Technical Levels: Supports and Resistances
EURJPY currently trading at 157.32 at the time of writing. Pair opened at 157.76 and is trading with a change of -0.28 % .
| Overview | Overview.1 | |
|---|---|---|
| 0 | Today last price | 157.32 |
| 1 | Today Daily Change | -0.44 |
| 2 | Today Daily Change % | -0.28 |
| 3 | Today daily open | 157.76 |
The pair remains strongly bullish on the daily timeframe. It trades above its 20 SMA @ 156.42, 50 SMA 153.2, 100 SMA @ 149.3 and 200 SMA @ 146.26.
| Trends | Trends.1 | |
|---|---|---|
| 0 | Daily SMA20 | 156.42 |
| 1 | Daily SMA50 | 153.20 |
| 2 | Daily SMA100 | 149.30 |
| 3 | Daily SMA200 | 146.26 |
The previous day high was 158.05 while the previous day low was 155.59. The daily 38.2% Fib levels comes at 157.11, expected to provide support. Similarly, the daily 61.8% fib level is at 156.53, expected to provide support.
Note the levels of interest below:
- Pivot support is noted at 156.22, 154.67, 153.76
- Pivot resistance is noted at 158.68, 159.6, 161.14
| Levels | Levels.1 |
|---|---|
| Previous Daily High | 158.05 |
| Previous Daily Low | 155.59 |
| Previous Weekly High | 158.05 |
| Previous Weekly Low | 154.88 |
| Previous Monthly High | 158.00 |
| Previous Monthly Low | 148.62 |
| Daily Fibonacci 38.2% | 157.11 |
| Daily Fibonacci 61.8% | 156.53 |
| Daily Pivot Point S1 | 156.22 |
| Daily Pivot Point S2 | 154.67 |
| Daily Pivot Point S3 | 153.76 |
| Daily Pivot Point R1 | 158.68 |
| Daily Pivot Point R2 | 159.60 |
| Daily Pivot Point R3 | 161.14 |
[/s2If]
Download Nehcap EAWe have two EAs that are operational on our LIVE accounts.
- EA-FIX: Check out the details here. Download EA-FIX . EA-FIX is a non-grid HFT scalper.
- EA-GROWTH: High quality low dd EA using trend grids. Download EA_GROWTHJoin Our Telegram Group
")


