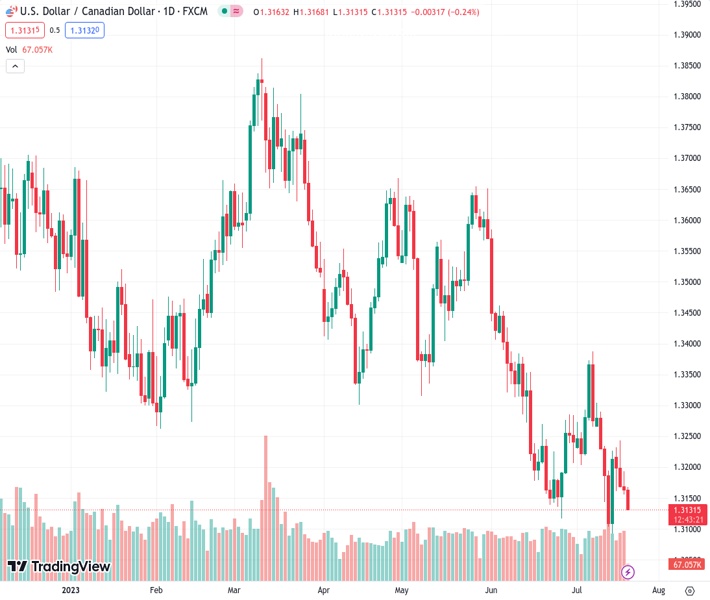
The USDCAD pair declines for the fourth consecutive day and reaches a new low for the week on Thursday.
…
This is a premium post.
[s2If !current_user_can(access_s2member_level4)]Please register for FREE REGISTER to read full post below containing analysis. In case of any error or you think you are not able to read the full post below, please email us at support#nehcap.com [lwa][/s2If] [s2If current_user_can(access_s2member_level1)]
- USD/CAD drifts lower for the fourth straight day and drops to a fresh weekly low on Thursday.
The pair currently trades last at 1.31353.
The previous day high was 1.3193 while the previous day low was 1.3156. The daily 38.2% Fib levels comes at 1.317, expected to provide resistance. Similarly, the daily 61.8% fib level is at 1.3179, expected to provide resistance.
The USD/CAD pair continues losing ground for the fourth successive day on Thursday and drops to a fresh weekly low during the early part of the European session. Spot prices currently trade just below mid-1.3100s, down less than 0.20% for the day, and remain well within the striking distance of the YTD trough touched last week.
The US Dollar (USD) fails to capitalize on its recovery from the lowest level since April 2022 touched on Tuesday and comes under some renewed selling pressure, which, in turn, is seen as a key factor dragging the USD/CAD pair lower. Market participants continue to price out the possibility of any further interest rate hikes by the Federal Reserve (Fed) after the widely anticipated 25 bps lift-off in July. This, along with the underlying bullish sentiment around the global equity markets, acts as a headwind for the safe-haven Greenback.
That said, concerns over slowing growth in China, the worsening US-China ties and geopolitical risks keep a lid on any further optimism. Furthermore, investors remain sceptic if the US central bank will commit to a more dovish policy stance or stick to its forecast for a 50 bps lift-off by the end of this year. This leads to a modest recovery in the US Treasury bond yields, which assists the USD to trim a part of its intraday losses and should limit losses for the USD/CAD pair, warranting caution before positioning for any further losses.
Meanwhile, Crude Oil prices struggle to gain any meaningful traction and remain below a technically significant 200-day Simple Moving Average (SMA) amid worries that a global economic downturn will dent fuel demand. Apart from this, the lower-than-expected drop in US crude inventories caps the upside for the black liquid. This could undermine the commodity-linked Loonie and lend some support to the USD/CAD pair, making it prudent to wait for acceptance below the 1.3100 mark before placing fresh bearish bets.
Market participants now look to the US economic docket, featuring the release of the usual Weekly Initial Jobless Claims, the Philly Fed Manufacturing Index and Existing Home Sales data. This, along with the US bond yields and the broader risk sentiment, will drive the USD demand and provide some impetus to the USD/CAD pair. Traders will further take cues from Oil price dynamics to grab short-term opportunities in the absence of any relevant macro data from Canada.
Technical Levels: Supports and Resistances
USDCAD currently trading at 1.3143 at the time of writing. Pair opened at 1.3164 and is trading with a change of -0.16 % .
| Overview | Overview.1 | |
|---|---|---|
| 0 | Today last price | 1.3143 |
| 1 | Today Daily Change | -0.0021 |
| 2 | Today Daily Change % | -0.1600 |
| 3 | Today daily open | 1.3164 |
The pair remains strongly bearish on the daily time frame. It trades below the 20 SMA @ 1.322, 50 SMA 1.3346, 100 SMA @ 1.3459 and 200 SMA @ 1.3482.
| Trends | Trends.1 | |
|---|---|---|
| 0 | Daily SMA20 | 1.3220 |
| 1 | Daily SMA50 | 1.3346 |
| 2 | Daily SMA100 | 1.3459 |
| 3 | Daily SMA200 | 1.3482 |
The previous day high was 1.3193 while the previous day low was 1.3156. The daily 38.2% Fib levels comes at 1.317, expected to provide resistance. Similarly, the daily 61.8% fib level is at 1.3179, expected to provide resistance.
Note the levels of interest below:
- Pivot support is noted at 1.3148, 1.3133, 1.3111
- Pivot resistance is noted at 1.3186, 1.3209, 1.3224
| Levels | Levels.1 |
|---|---|
| Previous Daily High | 1.3193 |
| Previous Daily Low | 1.3156 |
| Previous Weekly High | 1.3304 |
| Previous Weekly Low | 1.3093 |
| Previous Monthly High | 1.3585 |
| Previous Monthly Low | 1.3117 |
| Daily Fibonacci 38.2% | 1.3170 |
| Daily Fibonacci 61.8% | 1.3179 |
| Daily Pivot Point S1 | 1.3148 |
| Daily Pivot Point S2 | 1.3133 |
| Daily Pivot Point S3 | 1.3111 |
| Daily Pivot Point R1 | 1.3186 |
| Daily Pivot Point R2 | 1.3209 |
| Daily Pivot Point R3 | 1.3224 |
[/s2If]
Download Nehcap EAWe have two EAs that are operational on our LIVE accounts.
- EA-FIX: Check out the details here. Download EA-FIX . EA-FIX is a non-grid HFT scalper.
- EA-GROWTH: High quality low dd EA using trend grids. Download EA_GROWTHJoin Our Telegram Group
")


