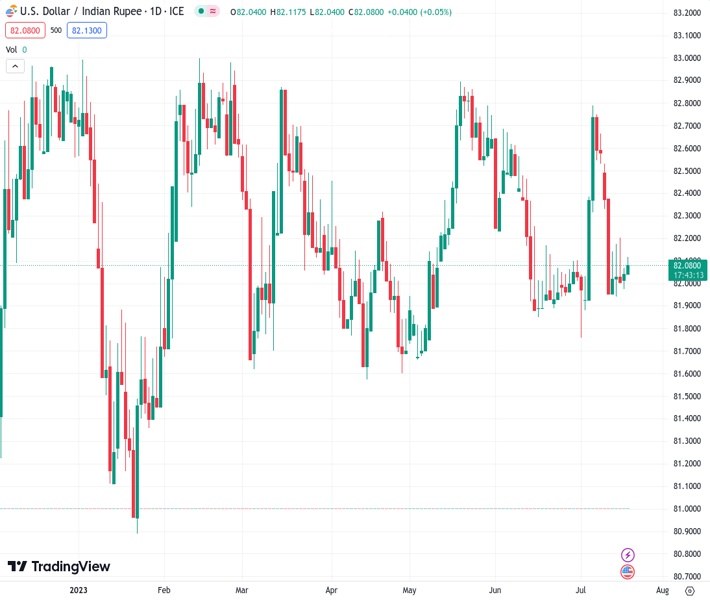
There is no clear direction for the USDINR exchange rate at 82.0970, and participants in the market are waiting for a decisive breakout.
…
This is a premium post.
[s2If !current_user_can(access_s2member_level4)]Please register for FREE REGISTER to read full post below containing analysis. In case of any error or you think you are not able to read the full post below, please email us at support#nehcap.com [lwa][/s2If] [s2If current_user_can(access_s2member_level1)]
- USD/INR lacks firm directional bias; market players await a valid breakout.
The pair currently trades last at 82.0970.
The previous day high was 82.1456 while the previous day low was 81.9675. The daily 38.2% Fib levels comes at 82.0776, expected to provide support. Similarly, the daily 61.8% fib level is at 82.0356, expected to provide support.
The USD/INR pair lacks any firm directional bias and oscillates within a large consolidation phase since October 2022. The cross currently trades around 82.10 during the Asian session on Wednesday.
That said, two converging trend-lines constitute the formation of a symmetrical triangle pattern on the daily chart. Market participants await a valid breakout for the next directional move for the cross. Meanwhile, the Relative Strength Index (RSI) holds between 40-60, reinforcing the non-directional movement for USD/INR.
A decisive break below 82.00 (the lower limit of the asymmetrical triangle pattern, a psychological round mark) will see a drop to a crucial support level of 81.70. The mentioned level represents the 200-day Exponential Moving Average (EMA). The additional downside filter to watch is 80.85 (Low of January 23, 2023), followed by 80.35, representing a low of November 11, 2022.
On the upside, any meaningful follow-through buying past 82.80 (the upper boundary of the asymmetrical triangle pattern) will challenge the next contention at 83.00, portraying a psychological round mark and a low of May 24. Further north, the cross will meet the next hurdle near 83.20 (High of December 23, 2022) en route to 83.40 (High of October 19, 2022).
Technical Levels: Supports and Resistances
USDINR currently trading at 82.0806 at the time of writing. Pair opened at 82.0781 and is trading with a change of 0.0 % .
| Overview | Overview.1 | |
|---|---|---|
| 0 | Today last price | 82.0806 |
| 1 | Today Daily Change | 0.0025 |
| 2 | Today Daily Change % | 0.0000 |
| 3 | Today daily open | 82.0781 |
The pair remains strongly bearish on the daily time frame. It trades below the 20 SMA @ 82.1567, 50 SMA 82.3106, 100 SMA @ 82.1955 and 200 SMA @ 82.1764.
| Trends | Trends.1 | |
|---|---|---|
| 0 | Daily SMA20 | 82.1567 |
| 1 | Daily SMA50 | 82.3106 |
| 2 | Daily SMA100 | 82.1955 |
| 3 | Daily SMA200 | 82.1764 |
The previous day high was 82.1456 while the previous day low was 81.9675. The daily 38.2% Fib levels comes at 82.0776, expected to provide support. Similarly, the daily 61.8% fib level is at 82.0356, expected to provide support.
Note the levels of interest below:
- Pivot support is noted at 81.9819, 81.8856, 81.8037
- Pivot resistance is noted at 82.16, 82.2419, 82.3382
| Levels | Levels.1 |
|---|---|
| Previous Daily High | 82.1456 |
| Previous Daily Low | 81.9675 |
| Previous Weekly High | 82.7256 |
| Previous Weekly Low | 81.9215 |
| Previous Monthly High | 82.7370 |
| Previous Monthly Low | 81.8477 |
| Daily Fibonacci 38.2% | 82.0776 |
| Daily Fibonacci 61.8% | 82.0356 |
| Daily Pivot Point S1 | 81.9819 |
| Daily Pivot Point S2 | 81.8856 |
| Daily Pivot Point S3 | 81.8037 |
| Daily Pivot Point R1 | 82.1600 |
| Daily Pivot Point R2 | 82.2419 |
| Daily Pivot Point R3 | 82.3382 |
[/s2If]
Download Nehcap EAWe have two EAs that are operational on our LIVE accounts.
- EA-FIX: Check out the details here. Download EA-FIX . EA-FIX is a non-grid HFT scalper.
- EA-GROWTH: High quality low dd EA using trend grids. Download EA_GROWTHJoin Our Telegram Group
")


