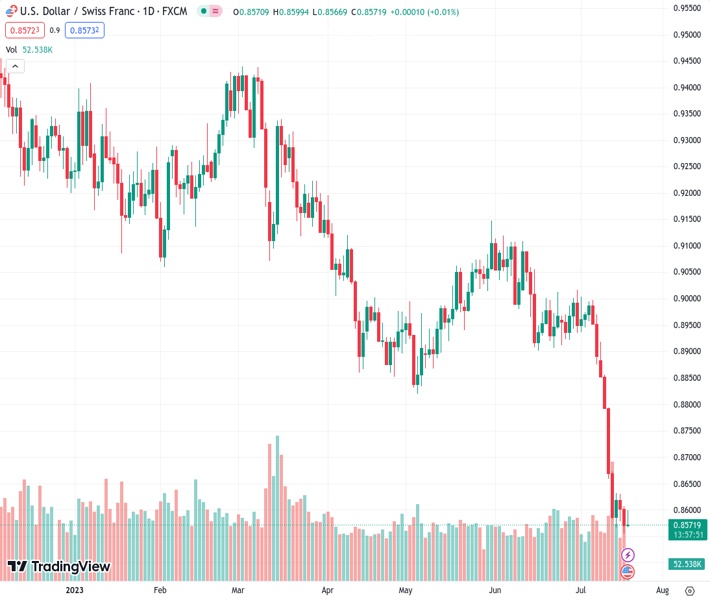
The USDCHF pair, with a value of 0.85786, has bounced back from its lowest point since January 2015. However, the prognosis from @nehcap suggests that any recovery will be minimal.
…
This is a premium post.
[s2If !current_user_can(access_s2member_level4)]Please register for FREE REGISTER to read full post below containing analysis. In case of any error or you think you are not able to read the full post below, please email us at support#nehcap.com [lwa][/s2If] [s2If current_user_can(access_s2member_level1)]
- USD/CHF reverses from the lowest level since January 2015.
The pair currently trades last at 0.85786.
The previous day high was 0.8608 while the previous day low was 0.8555. The daily 38.2% Fib levels comes at 0.8575, expected to provide support. Similarly, the daily 61.8% fib level is at 0.8588, expected to provide resistance.
USD/CHF consolidates weekly/monthly losses around 0.8580-85 heading into Wednesday’s European session, printing the first daily gain in three.
In doing so, the Swiss Franc (CHF) pair bounces off the lowest level since January 2015 amid an oversold RSI (14) line.
The major currency pair’s recovery, however, appears doubtful amid the bearish MACD signals and the presence of the 0.8630 resistance confluence comprising the previous support line from early February and a fortnight-old descending trend line.
Even if the USD/CHF bulls manage to cross the 0.8630 hurdle May’s bottom of around 0.8820 will be a tough nut to crack for them before retaking control.
That said, 0.8600, 0.8700 and 0.8800 round figures may offer additional challenges to the pair buyers while the 21-DMA level of around 0.8845 acts as the final defense of the bears.
On the contrary, multiple levels around the 0.8580 level marked in January 2015 prod the USD/CHF bears before directing them to the year 2015 bottom of 0.8300.
Overall, the USD/CHF pair’s latest corrective bounce can be considered as bears taking a breather at the multi-day low.
Trend: Limited recovery expected
Technical Levels: Supports and Resistances
USDCHF currently trading at 0.8598 at the time of writing. Pair opened at 0.8575 and is trading with a change of 0.27% % .
| Overview | Overview.1 | |
|---|---|---|
| 0 | Today last price | 0.8598 |
| 1 | Today Daily Change | 0.0023 |
| 2 | Today Daily Change % | 0.27% |
| 3 | Today daily open | 0.8575 |
The pair remains strongly bearish on the daily time frame. It trades below the 20 SMA @ 0.8857, 50 SMA 0.8953, 100 SMA @ 0.9025 and 200 SMA @ 0.9239.
| Trends | Trends.1 | |
|---|---|---|
| 0 | Daily SMA20 | 0.8857 |
| 1 | Daily SMA50 | 0.8953 |
| 2 | Daily SMA100 | 0.9025 |
| 3 | Daily SMA200 | 0.9239 |
The previous day high was 0.8608 while the previous day low was 0.8555. The daily 38.2% Fib levels comes at 0.8575, expected to provide support. Similarly, the daily 61.8% fib level is at 0.8588, expected to provide resistance.
Note the levels of interest below:
- Pivot support is noted at 0.8551, 0.8527, 0.8499
- Pivot resistance is noted at 0.8604, 0.8632, 0.8656
| Levels | Levels.1 |
|---|---|
| Previous Daily High | 0.8608 |
| Previous Daily Low | 0.8555 |
| Previous Weekly High | 0.8918 |
| Previous Weekly Low | 0.8566 |
| Previous Monthly High | 0.9120 |
| Previous Monthly Low | 0.8902 |
| Daily Fibonacci 38.2% | 0.8575 |
| Daily Fibonacci 61.8% | 0.8588 |
| Daily Pivot Point S1 | 0.8551 |
| Daily Pivot Point S2 | 0.8527 |
| Daily Pivot Point S3 | 0.8499 |
| Daily Pivot Point R1 | 0.8604 |
| Daily Pivot Point R2 | 0.8632 |
| Daily Pivot Point R3 | 0.8656 |
[/s2If]
Download Nehcap EAWe have two EAs that are operational on our LIVE accounts.
- EA-FIX: Check out the details here. Download EA-FIX . EA-FIX is a non-grid HFT scalper.
- EA-GROWTH: High quality low dd EA using trend grids. Download EA_GROWTHJoin Our Telegram Group
")


