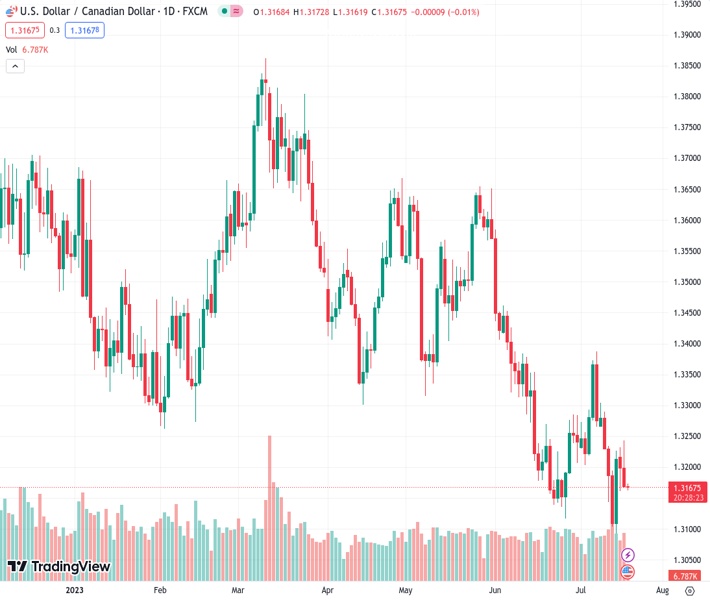
The USDCAD pair is still under pressure and holding near the 1.3170 level.
…
This is a premium post.
[s2If !current_user_can(access_s2member_level4)]Please register for FREE REGISTER to read full post below containing analysis. In case of any error or you think you are not able to read the full post below, please email us at support#nehcap.com [lwa][/s2If] [s2If current_user_can(access_s2member_level1)]
- USD/CAD remains on the defensive near the 1.3170 mark.
The pair currently trades last at 1.31663.
The previous day high was 1.3244 while the previous day low was 1.3167. The daily 38.2% Fib levels comes at 1.3196, expected to provide resistance. Similarly, the daily 61.8% fib level is at 1.3214, expected to provide resistance.
The USD/CAD pair remains under pressure and currently trades around 1.3160 regions in the early Asian session. The weakening US Dollar is backed by the Industrial Production surprises to the downside and the softer inflation data last week. Investors will look to the Canadian Retail Sales m/m for fresh impetus.
The Canadian Consumer Price Index (CPI) fell to 2.8% YoY in June, down from 3.4% in May. This number was lower than the market’s expectation of 3%. The CPI rose 0.1% MoM, compared to market expectations of a 0.3% increase. Additionally, the monthly Core CPI, which excludes volatile food and energy prices, fell 0.1%, while the annual Core CPI stood at 3.2%, down from 3.7% in May.
The softer Canadian core inflation exerts some pressure on the Loonie as the data lowers the possibility that the Bank of Canada (BoC) will raise interest rates at its September meeting. Nevertheless, the Canadian Dollar (CAD) recovers against the US Dollar. A reversal in crude oil prices help limit the loss in the commodity-linked Loonie and weighed on the USD/CAD pair.
Additionally, the release of US Industrial Production data for June surprises to the downside and shows a prolonged decline of industrial output. On Tuesday, the US Federal Reserve reported that Industrial Production fell 0.5% in June for the second month. This figure was lower than the market expected of no change.
Also, Retail sales in the United States increased 0.2% MoM in June to $689.5 billion, according to data released by the US Census Bureau. This report came in below the market’s forecast of a 0.5% gain. On the positive side, the 0.3% growth figure recorded in May was revised up to 0.5%.
Looking ahead, the Canadian Retail Sales m/m will be keenly watched. The softer data might cap the downside for the USD/CAD pair. On the US docket, the Unemployment Claims will be released on Thursday.
Technical Levels: Supports and Resistances
USDCAD currently trading at 1.3172 at the time of writing. Pair opened at 1.3169 and is trading with a change of 0.02 % .
| Overview | Overview.1 | |
|---|---|---|
| 0 | Today last price | 1.3172 |
| 1 | Today Daily Change | 0.0003 |
| 2 | Today Daily Change % | 0.0200 |
| 3 | Today daily open | 1.3169 |
The pair remains strongly bearish on the daily time frame. It trades below the 20 SMA @ 1.322, 50 SMA 1.335, 100 SMA @ 1.3463 and 200 SMA @ 1.3486.
| Trends | Trends.1 | |
|---|---|---|
| 0 | Daily SMA20 | 1.3220 |
| 1 | Daily SMA50 | 1.3350 |
| 2 | Daily SMA100 | 1.3463 |
| 3 | Daily SMA200 | 1.3486 |
The previous day high was 1.3244 while the previous day low was 1.3167. The daily 38.2% Fib levels comes at 1.3196, expected to provide resistance. Similarly, the daily 61.8% fib level is at 1.3214, expected to provide resistance.
Note the levels of interest below:
- Pivot support is noted at 1.3143, 1.3117, 1.3067
- Pivot resistance is noted at 1.3219, 1.3269, 1.3295
| Levels | Levels.1 |
|---|---|
| Previous Daily High | 1.3244 |
| Previous Daily Low | 1.3167 |
| Previous Weekly High | 1.3304 |
| Previous Weekly Low | 1.3093 |
| Previous Monthly High | 1.3585 |
| Previous Monthly Low | 1.3117 |
| Daily Fibonacci 38.2% | 1.3196 |
| Daily Fibonacci 61.8% | 1.3214 |
| Daily Pivot Point S1 | 1.3143 |
| Daily Pivot Point S2 | 1.3117 |
| Daily Pivot Point S3 | 1.3067 |
| Daily Pivot Point R1 | 1.3219 |
| Daily Pivot Point R2 | 1.3269 |
| Daily Pivot Point R3 | 1.3295 |
[/s2If]
Download Nehcap EAWe have two EAs that are operational on our LIVE accounts.
- EA-FIX: Check out the details here. Download EA-FIX . EA-FIX is a non-grid HFT scalper.
- EA-GROWTH: High quality low dd EA using trend grids. Download EA_GROWTHJoin Our Telegram Group
")


