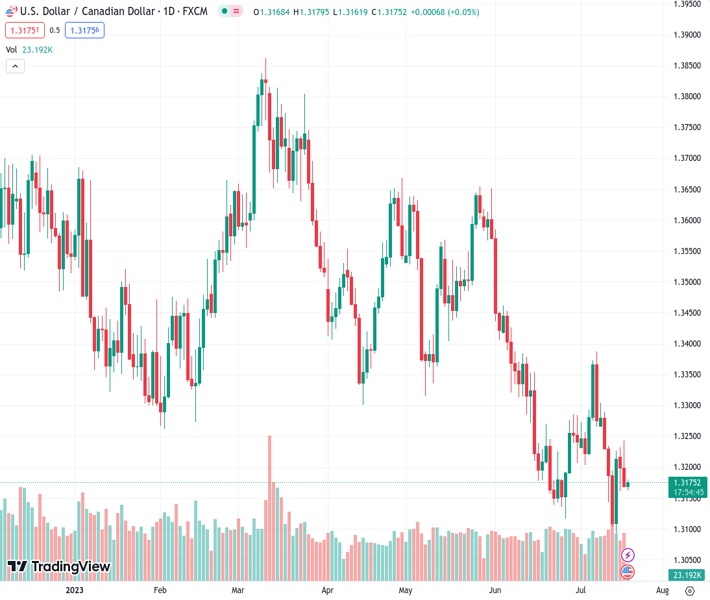
The USDCAD currency pair, currently trading at 1.31760, is experiencing a shift away from a negative outlook after a two-day decline. However, it is facing difficulty in attracting positive market sentiment.
…
This is a premium post.
[s2If !current_user_can(access_s2member_level4)]Please register for FREE REGISTER to read full post below containing analysis. In case of any error or you think you are not able to read the full post below, please email us at support#nehcap.com [lwa][/s2If] [s2If current_user_can(access_s2member_level1)]
- USD/CAD pushes back bearish bias after two-day losing streak but struggles to welcome bulls.
The pair currently trades last at 1.31760.
The previous day high was 1.3244 while the previous day low was 1.3167. The daily 38.2% Fib levels comes at 1.3196, expected to provide resistance. Similarly, the daily 61.8% fib level is at 1.3214, expected to provide resistance.
USD/CAD remains dicey around 1.3170-80 during early Wednesday morning in Europe, despite pausing a two-day downtrend, as market players seek more clues to defend the Loonie pair buyers amid a sluggish Asian session.
That said, the downbeat prints of Canada’s headline inflation numbers contrast with upbeat details of the US Retail Sales, as well as a pullback in WTI Crude Oil, the biggest Canadian export earner, to lure the USD/CAD buyers. However, risk-on mood and dovish Fed concerns seem to prod the Loonie pair’s upside momentum of late.
On Tuesday, Canada’s Consumer Price Index (CPI) for June eased to 2.8% YoY from 3.0% expected and 3.4% prior. More importantly, the Bank of Canada (BoC) CPI Core also softened to 3.2% YoY from 3.7% expected and 3.5% expected. On the other hand, US Retail Sales growth for June came in as 0.2% MoM versus 0.5% expected and prior (revised). However, the Retail Sales Control Group marked 0.6% growth versus market forecasts of -0.3% and 0.3% previous readings. It should be noted that the US Industrial Production reprinted -0.5% for June compared to analysts’ estimations of 0.0%.
Elsewhere, WTI crude oil drops 0.35% to $75.40 by the press time as it consolidates the biggest daily gains since July 07 amid fears of lower energy demand from China, as well as on hopes of higher supplies from Nigeria and Libya.
That said, China Industry Ministry recently conveyed fears of insufficient demand and declining revenues and justifies the downbeat Gross Domestic Product (GDP) data for the second quarter (Q2) that suggested fears of easing economic recovery in the world’s biggest industrial player. Considering China’s status as one of the biggest oil users, downbeat economic concerns about the dragon nation weigh on the commodity price and underpin the USD/CAD rebound.
On a different page, the US Dollar Index (DXY) edges higher around 100.05, after bouncing off the 15-month low surrounding 99.55 the previous day. In doing so, the greenback’s gauge versus the six major currencies struggles to justify dovish Fed concerns. That said, the latest Reuters poll of around 109 economists suggests that the Fed’s widely anticipated 25 basis points (bps) rate hike in July will be the last increase of the current tightening cycle.
The Fed chatters, however, allow the markets to remain positive together with the headlines from China suggesting that the Sino-American ties are not deteriorating further, even if the progress is minimal.
It should be noted that the share prices of the top-tier US banks like Bank of America, Morgan Stanley and Bank of New York Mellon Corp rallied on Tuesday and favored the risk-on mood amid news that higher interest rates had helped boost profits in the second quarter, shared via Reuters.
Although the 1.3100 round figure puts a floor under the USD/CAD price, a convergence of the 10-SMA and 21-SMA on the daily chart, around 1.3220, restricts the short-term rebound of the Loonie pair.
Technical Levels: Supports and Resistances
USDCAD currently trading at 1.3176 at the time of writing. Pair opened at 1.3169 and is trading with a change of 0.05% % .
| Overview | Overview.1 | |
|---|---|---|
| 0 | Today last price | 1.3176 |
| 1 | Today Daily Change | 0.0007 |
| 2 | Today Daily Change % | 0.05% |
| 3 | Today daily open | 1.3169 |
The pair remains strongly bearish on the daily time frame. It trades below the 20 SMA @ 1.322, 50 SMA 1.335, 100 SMA @ 1.3463 and 200 SMA @ 1.3486.
| Trends | Trends.1 | |
|---|---|---|
| 0 | Daily SMA20 | 1.3220 |
| 1 | Daily SMA50 | 1.3350 |
| 2 | Daily SMA100 | 1.3463 |
| 3 | Daily SMA200 | 1.3486 |
The previous day high was 1.3244 while the previous day low was 1.3167. The daily 38.2% Fib levels comes at 1.3196, expected to provide resistance. Similarly, the daily 61.8% fib level is at 1.3214, expected to provide resistance.
Note the levels of interest below:
- Pivot support is noted at 1.3143, 1.3117, 1.3067
- Pivot resistance is noted at 1.3219, 1.3269, 1.3295
| Levels | Levels.1 |
|---|---|
| Previous Daily High | 1.3244 |
| Previous Daily Low | 1.3167 |
| Previous Weekly High | 1.3304 |
| Previous Weekly Low | 1.3093 |
| Previous Monthly High | 1.3585 |
| Previous Monthly Low | 1.3117 |
| Daily Fibonacci 38.2% | 1.3196 |
| Daily Fibonacci 61.8% | 1.3214 |
| Daily Pivot Point S1 | 1.3143 |
| Daily Pivot Point S2 | 1.3117 |
| Daily Pivot Point S3 | 1.3067 |
| Daily Pivot Point R1 | 1.3219 |
| Daily Pivot Point R2 | 1.3269 |
| Daily Pivot Point R3 | 1.3295 |
[/s2If]
Download Nehcap EAWe have two EAs that are operational on our LIVE accounts.
- EA-FIX: Check out the details here. Download EA-FIX . EA-FIX is a non-grid HFT scalper.
- EA-GROWTH: High quality low dd EA using trend grids. Download EA_GROWTHJoin Our Telegram Group
")


