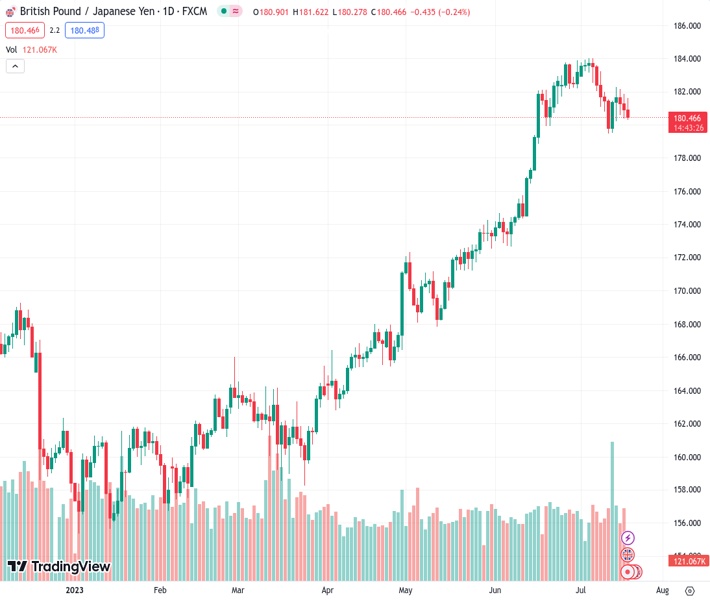
The GBPJPY pair, currently at 180.408, is experiencing a decline for the third day in a row, as sellers continue to push the price towards its intraday low.
…
This is a premium post.
[s2If !current_user_can(access_s2member_level4)]Please register for FREE REGISTER to read full post below containing analysis. In case of any error or you think you are not able to read the full post below, please email us at support#nehcap.com [lwa][/s2If] [s2If current_user_can(access_s2member_level1)]
- GBP/JPY takes offers to refresh intraday low down for the third consecutive day.
The pair currently trades last at 180.408.
The previous day high was 181.85 while the previous day low was 180.37. The daily 38.2% Fib levels comes at 180.93, expected to provide resistance. Similarly, the daily 61.8% fib level is at 181.28, expected to provide resistance.
GBP/JPY reverses the day-start recovery towards refreshing the intraday trough to around 180.80 amid early Wednesday morning in London, justifying the unwelcome prints of the UK inflation. Adding strength to the downside bias are the weaker Treasury bond yields. However, the market’s cautious optimism and dovish bias surrounding the Bank of Japan (BoJ) prod the cross-currency sellers of late.
UK inflation per the Consumer Price Index (CPI) slides to 7.9% YoY in June versus 8.2% expected and 8.7% prior. More importantly, the Core CPI defies the 7.1% market forecast and previous readings by declining to with 6.9% YoY figures for the said month.
With this, the hawkish bias about the Bank of England (BoE) remains doubtful and drowns the GBP/JPY during the three-day losing streak.
On the other hand, Bank of Japan (BOJ) Governor Kazuo Ueda spoke at a news conference after the G20 meeting in India on Tuesday while stating that there was still some distance to sustainably achieve the 2% inflation target, defending the easy-money policy in turn.
It’s worth noting that fears surrounding Japan Prime Minister (PM) Fumio Kishida’s cabinet reshuffle and pessimism among the big industrial houses from Tokyo weigh on the Japanese Yen (JPY) and challenge the GBP/JPY bears.
Elsewhere, the market sentiment remains cautiously optimistic amid the upbeat performance of the equities backed by the positive mood at the banks, as well as China headlines, which in turn puts a floor under the GBP/JPY prices.
While portraying the mood, Japan’s Nikkei 225 rises more than 1.0% and the S&P500 Futures remain sidelined at the yearly high. However, the US 10-year and two-year Treasury bond yields stay pressured at 3.76% and 4.74% by the press time and prod the GBP/JPY bulls of late.
Having witnessed the initial market reaction to the UK inflation data, the GBP/JPY pair traders should watch the risk catalysts ahead of Friday’s Japan inflation statistics and British Retail Sales.
A convergence of the 10-DMA and a fortnight-old descending trend line, around 181.65, challenges the GBP/JPY buyers despite the latest run-up.
Technical Levels: Supports and Resistances
GBPJPY currently trading at 181.56 at the time of writing. Pair opened at 180.98 and is trading with a change of 0.32% % .
| Overview | Overview.1 | |
|---|---|---|
| 0 | Today last price | 181.56 |
| 1 | Today Daily Change | 0.58 |
| 2 | Today Daily Change % | 0.32% |
| 3 | Today daily open | 180.98 |
The pair is trading below its 20 Daily moving average @ 182.33, above its 50 Daily moving average @ 177.3 , above its 100 Daily moving average @ 171.13 and above its 200 Daily moving average @ 167.38
| Trends | Trends.1 | |
|---|---|---|
| 0 | Daily SMA20 | 182.33 |
| 1 | Daily SMA50 | 177.30 |
| 2 | Daily SMA100 | 171.13 |
| 3 | Daily SMA200 | 167.38 |
The previous day high was 181.85 while the previous day low was 180.37. The daily 38.2% Fib levels comes at 180.93, expected to provide resistance. Similarly, the daily 61.8% fib level is at 181.28, expected to provide resistance.
Note the levels of interest below:
- Pivot support is noted at 180.28, 179.58, 178.8
- Pivot resistance is noted at 181.77, 182.55, 183.25
| Levels | Levels.1 |
|---|---|
| Previous Daily High | 181.85 |
| Previous Daily Low | 180.37 |
| Previous Weekly High | 183.23 |
| Previous Weekly Low | 179.47 |
| Previous Monthly High | 183.88 |
| Previous Monthly Low | 172.67 |
| Daily Fibonacci 38.2% | 180.93 |
| Daily Fibonacci 61.8% | 181.28 |
| Daily Pivot Point S1 | 180.28 |
| Daily Pivot Point S2 | 179.58 |
| Daily Pivot Point S3 | 178.80 |
| Daily Pivot Point R1 | 181.77 |
| Daily Pivot Point R2 | 182.55 |
| Daily Pivot Point R3 | 183.25 |
[/s2If]
Download Nehcap EAWe have two EAs that are operational on our LIVE accounts.
- EA-FIX: Check out the details here. Download EA-FIX . EA-FIX is a non-grid HFT scalper.
- EA-GROWTH: High quality low dd EA using trend grids. Download EA_GROWTHJoin Our Telegram Group
")


