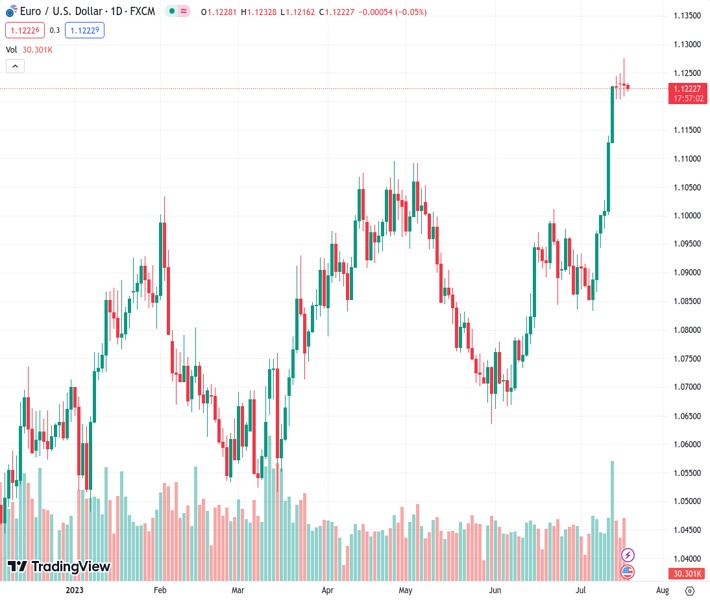
The EURUSD currency pair declined on Wednesday, moving farther away from its year-to-date high, with a current rate of 1.12217.
…
This is a premium post.
[s2If !current_user_can(access_s2member_level4)]Please register for FREE REGISTER to read full post below containing analysis. In case of any error or you think you are not able to read the full post below, please email us at support#nehcap.com [lwa][/s2If] [s2If current_user_can(access_s2member_level1)]
- EUR/USD edges lower on Wednesday and moves further away from the YTD peak.
The pair currently trades last at 1.12217.
The previous day high was 1.1276 while the previous day low was 1.1209. The daily 38.2% Fib levels comes at 1.1234, expected to provide resistance. Similarly, the daily 61.8% fib level is at 1.125, expected to provide resistance.
The EUR/USD pair struggles to gain any meaningful traction on Wednesday and oscillates in a narrow trading band, above the 1.1200 mark through the Asian session.
European Central Bank (ECB) officials delivered mixed signals regarding the next policy moves after the July meeting, which led to a significant decline in the German yields on Tuesday and in turn, is seen undermining the shared currency. The US Dollar (USD), on the other hand, struggles to capitalize on the overnight bounce from its lowest level since April 2022 amid growing acceptance that the Federal Reserve (Fed) will soften its hawkish stance. This is holding back traders from placing bearish bets around the EUR/USD pair and positioning for an extension of the previous day’s modest pullback from the 1.1275 region, or the highest level since February 2022.
From a technical perspective, the range-bound price action witnessed over the past four days constitutes the formation of a rectangle on short-term charts. Against the backdrop of the recent rally from the 100-day Simple Moving Average (SMA), this might still be categorized as a bullish consolidation phase. That said, the Relative Strength Index (RSI) on the daily chart is flashing overbought conditions and acting as a headwind for the EUR/USD pair. Nevertheless, the setup still favours bullish traders and suggests that the path of least resistance for spot prices is to the upside. Hence, any subsequent pullback might still be seen as a buying opportunity and remain limited.
The weekly low, around the 1.1200 mark, is likely to protect the immediate downside. Sustained weakness below could trigger a fresh bout of technical selling and drag the EUR/USD pair towards the 1.1145 support zone. Some follow-through selling could pave the way for additional losses, though is likely to get bought into near the 1.1100 round figure. The latter should act as a strong base for spot prices, which if broken decisively would negate the near-term positive outlook.
On the flip side, the 1.1245-1.1250 region, followed by the multi-month peak, around the 1.1275 zone, now seem to pose immediate resistance ahead of the 1.1300 round-figure mark. The next relevant hurdle is pegged near the 1.1335 area, above which the EUR/USD pair could aim to reclaim the 1.1400 mark and climb further towards the 1.1450 region en route to the 1.1500 psychological mark, or the 2022 yearly peak.
Technical Levels: Supports and Resistances
EURUSD currently trading at 1.1218 at the time of writing. Pair opened at 1.1229 and is trading with a change of -0.1 % .
| Overview | Overview.1 | |
|---|---|---|
| 0 | Today last price | 1.1218 |
| 1 | Today Daily Change | -0.0011 |
| 2 | Today Daily Change % | -0.1000 |
| 3 | Today daily open | 1.1229 |
The pair remains strongly bullish on the daily timeframe. It trades above its 20 SMA @ 1.0998, 50 SMA 1.0879, 100 SMA @ 1.0867 and 200 SMA @ 1.0668.
| Trends | Trends.1 | |
|---|---|---|
| 0 | Daily SMA20 | 1.0998 |
| 1 | Daily SMA50 | 1.0879 |
| 2 | Daily SMA100 | 1.0867 |
| 3 | Daily SMA200 | 1.0668 |
The previous day high was 1.1276 while the previous day low was 1.1209. The daily 38.2% Fib levels comes at 1.1234, expected to provide resistance. Similarly, the daily 61.8% fib level is at 1.125, expected to provide resistance.
Note the levels of interest below:
- Pivot support is noted at 1.12, 1.1171, 1.1133
- Pivot resistance is noted at 1.1267, 1.1305, 1.1333
| Levels | Levels.1 |
|---|---|
| Previous Daily High | 1.1276 |
| Previous Daily Low | 1.1209 |
| Previous Weekly High | 1.1245 |
| Previous Weekly Low | 1.0944 |
| Previous Monthly High | 1.1012 |
| Previous Monthly Low | 1.0662 |
| Daily Fibonacci 38.2% | 1.1234 |
| Daily Fibonacci 61.8% | 1.1250 |
| Daily Pivot Point S1 | 1.1200 |
| Daily Pivot Point S2 | 1.1171 |
| Daily Pivot Point S3 | 1.1133 |
| Daily Pivot Point R1 | 1.1267 |
| Daily Pivot Point R2 | 1.1305 |
| Daily Pivot Point R3 | 1.1333 |
[/s2If]
Download Nehcap EAWe have two EAs that are operational on our LIVE accounts.
- EA-FIX: Check out the details here. Download EA-FIX . EA-FIX is a non-grid HFT scalper.
- EA-GROWTH: High quality low dd EA using trend grids. Download EA_GROWTHJoin Our Telegram Group
")


