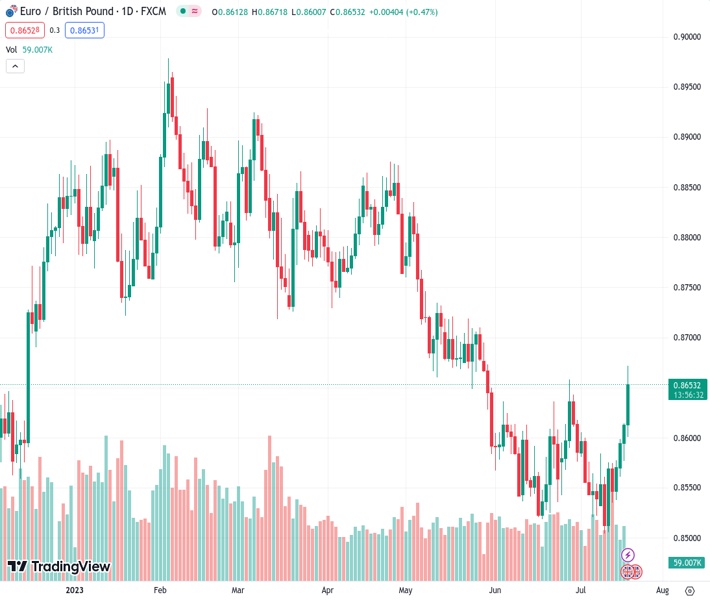
The EURGBP currency pair, currently trading at 0.86517, is gathering strength and continues to move higher towards 0.8670.
…
This is a premium post.
[s2If !current_user_can(access_s2member_level4)]Please register for FREE REGISTER to read full post below containing analysis. In case of any error or you think you are not able to read the full post below, please email us at support#nehcap.com [lwa][/s2If] [s2If current_user_can(access_s2member_level1)]
- EUR/GBP gains momentum and extends its upside to 0.8670.
The pair currently trades last at 0.86517.
The previous day high was 0.8614 while the previous day low was 0.8577. The daily 38.2% Fib levels comes at 0.86, expected to provide support. Similarly, the daily 61.8% fib level is at 0.8591, expected to provide support.
The EUR/GBP pair extends its upside and surges above the key resistance level at 0.8600 on Wednesday. The cross currently trades around 0.8670, up to 0.66% on the day.
According to the daily chart, EUR/GBP is set to break above the upper boundary of the Bollinger Band. A decisive break above the latter will see a fresh move higher to 0.8680, representing the 200-day Exponential Moving Average (EMA). Further north, the cross will challenge the next barrier at 0.8720 (Low of March 15, 2023) en route to 0.8830 (High of November 9, 2022).
On the flip side, EUR/GBP will meet an initial support level of 0.8580 (the midline of the Bollinger Band), followed by 0.8550 (Low of December 1, 2022). The additional downside filter to watch is 0.8510, the lower limit of the Bollinger Band and low of July 11.
The Relative Strength Index (RSI) stands above 60, suggesting that the path of least resistance for the EUR/GBP cross is to the upside.
Technical Levels: Supports and Resistances
EURGBP currently trading at 0.8666 at the time of writing. Pair opened at 0.8613 and is trading with a change of 0.62 % .
| Overview | Overview.1 | |
|---|---|---|
| 0 | Today last price | 0.8666 |
| 1 | Today Daily Change | 0.0053 |
| 2 | Today Daily Change % | 0.6200 |
| 3 | Today daily open | 0.8613 |
The pair is trading above its 20 Daily moving average @ 0.8577, above its 50 Daily moving average @ 0.861 , below its 100 Daily moving average @ 0.8709 and below its 200 Daily moving average @ 0.873
| Trends | Trends.1 | |
|---|---|---|
| 0 | Daily SMA20 | 0.8577 |
| 1 | Daily SMA50 | 0.8610 |
| 2 | Daily SMA100 | 0.8709 |
| 3 | Daily SMA200 | 0.8730 |
The previous day high was 0.8614 while the previous day low was 0.8577. The daily 38.2% Fib levels comes at 0.86, expected to provide support. Similarly, the daily 61.8% fib level is at 0.8591, expected to provide support.
Note the levels of interest below:
- Pivot support is noted at 0.8589, 0.8564, 0.8551
- Pivot resistance is noted at 0.8626, 0.8639, 0.8664
| Levels | Levels.1 |
|---|---|
| Previous Daily High | 0.8614 |
| Previous Daily Low | 0.8577 |
| Previous Weekly High | 0.8584 |
| Previous Weekly Low | 0.8504 |
| Previous Monthly High | 0.8658 |
| Previous Monthly Low | 0.8518 |
| Daily Fibonacci 38.2% | 0.8600 |
| Daily Fibonacci 61.8% | 0.8591 |
| Daily Pivot Point S1 | 0.8589 |
| Daily Pivot Point S2 | 0.8564 |
| Daily Pivot Point S3 | 0.8551 |
| Daily Pivot Point R1 | 0.8626 |
| Daily Pivot Point R2 | 0.8639 |
| Daily Pivot Point R3 | 0.8664 |
[/s2If]
Download Nehcap EAWe have two EAs that are operational on our LIVE accounts.
- EA-FIX: Check out the details here. Download EA-FIX . EA-FIX is a non-grid HFT scalper.
- EA-GROWTH: High quality low dd EA using trend grids. Download EA_GROWTHJoin Our Telegram Group
")


