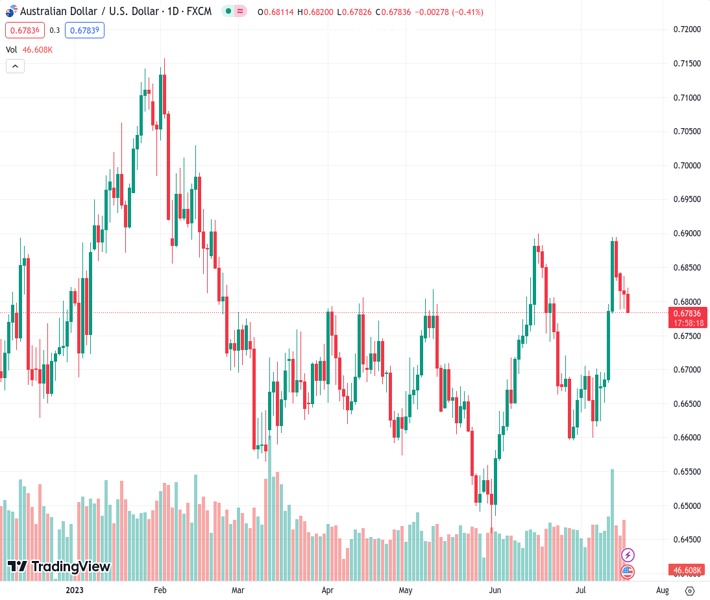
The AUDUSD pair declines to a lower level of 0.67830, indicating a continuation of the four-day downward trend and reaching a new weekly low. The perspective from @nehcap indicates that there is an expectation for further declines.
…
This is a premium post.
[s2If !current_user_can(access_s2member_level4)]Please register for FREE REGISTER to read full post below containing analysis. In case of any error or you think you are not able to read the full post below, please email us at support#nehcap.com [lwa][/s2If] [s2If current_user_can(access_s2member_level1)]
- AUD/USD takes offers to refresh intraday low, prints four-day downtrend to renew weekly bottom.
The pair currently trades last at 0.67830.
The previous day high was 0.6837 while the previous day low was 0.6789. The daily 38.2% Fib levels comes at 0.6808, expected to provide resistance. Similarly, the daily 61.8% fib level is at 0.6819, expected to provide resistance.
AUD/USD slides to 0.6780 as it refreshes its weekly low during the four-day losing streak very early Wednesday morning in Europe. In doing so, the Aussie pair justifies the broad US Dollar strength, while ignoring upbeat prints of Australia’s Westpac Leading Index for June.
Also read: S&P500 Futures flirt with yearly top, Treasury bond yields drift lower as US banks, Fed chatters prod traders
That said, the risk-barometer pair’s downside break of a one-month-old horizontal support zone, now immediate resistance around 0.6800-05, joins the bearish MACD signals to lure the AUD/USD sellers.
With this, the major currency pair is all set to revisit a horizontal area comprising multiple levels marked since early June around 0.6740.
However, the 200-SMA level of near 0.6730 and a seven-week-old ascending support line, around 0.6665, appear tough nuts to crack for the AUD/USD bears afterward.
Meanwhile, the Aussie pair’s recovery beyond 0.6805 remains unimpressive unless it crosses the weekly top surrounding 0.6840.
Even so, the double top bearish chart formation around the 0.6900 round figure appears the key challenge for the AUD/USD bulls to tackle to restore the market confidence.
Trend: Further downside expected
Technical Levels: Supports and Resistances
AUDUSD currently trading at 0.6785 at the time of writing. Pair opened at 0.6811 and is trading with a change of -0.38% % .
| Overview | Overview.1 | |
|---|---|---|
| 0 | Today last price | 0.6785 |
| 1 | Today Daily Change | -0.0026 |
| 2 | Today Daily Change % | -0.38% |
| 3 | Today daily open | 0.6811 |
The pair remains strongly bullish on the daily timeframe. It trades above its 20 SMA @ 0.6716, 50 SMA 0.6688, 100 SMA @ 0.6687 and 200 SMA @ 0.6711.
| Trends | Trends.1 | |
|---|---|---|
| 0 | Daily SMA20 | 0.6716 |
| 1 | Daily SMA50 | 0.6688 |
| 2 | Daily SMA100 | 0.6687 |
| 3 | Daily SMA200 | 0.6711 |
The previous day high was 0.6837 while the previous day low was 0.6789. The daily 38.2% Fib levels comes at 0.6808, expected to provide resistance. Similarly, the daily 61.8% fib level is at 0.6819, expected to provide resistance.
Note the levels of interest below:
- Pivot support is noted at 0.6788, 0.6765, 0.674
- Pivot resistance is noted at 0.6836, 0.6861, 0.6884
| Levels | Levels.1 |
|---|---|
| Previous Daily High | 0.6837 |
| Previous Daily Low | 0.6789 |
| Previous Weekly High | 0.6895 |
| Previous Weekly Low | 0.6624 |
| Previous Monthly High | 0.6900 |
| Previous Monthly Low | 0.6484 |
| Daily Fibonacci 38.2% | 0.6808 |
| Daily Fibonacci 61.8% | 0.6819 |
| Daily Pivot Point S1 | 0.6788 |
| Daily Pivot Point S2 | 0.6765 |
| Daily Pivot Point S3 | 0.6740 |
| Daily Pivot Point R1 | 0.6836 |
| Daily Pivot Point R2 | 0.6861 |
| Daily Pivot Point R3 | 0.6884 |
[/s2If]
Download Nehcap EAWe have two EAs that are operational on our LIVE accounts.
- EA-FIX: Check out the details here. Download EA-FIX . EA-FIX is a non-grid HFT scalper.
- EA-GROWTH: High quality low dd EA using trend grids. Download EA_GROWTHJoin Our Telegram Group
")


