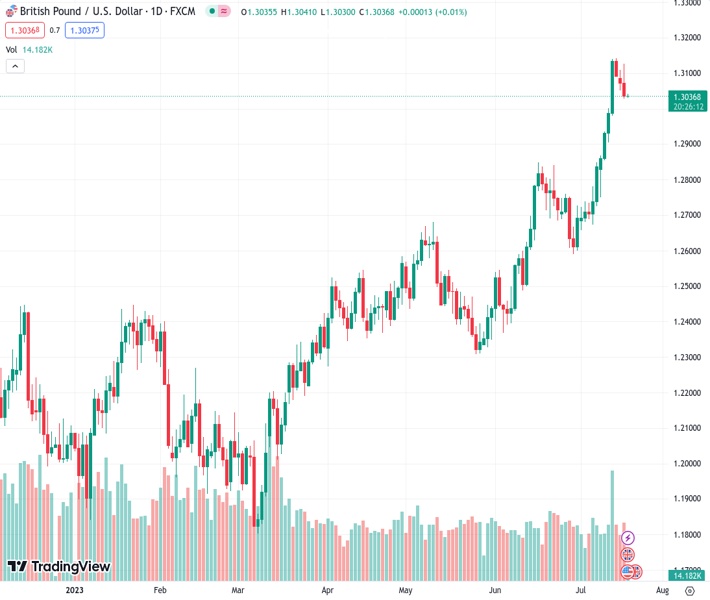
GBPUSD is maintaining a defensive stance near its lowest point of the day following three consecutive days of losses. According to Nehcap’s perspective, it is anticipated that any further decline will be limited.
…
This is a premium post.
[s2If !current_user_can(access_s2member_level4)]Please register for FREE REGISTER to read full post below containing analysis. In case of any error or you think you are not able to read the full post below, please email us at support#nehcap.com [lwa][/s2If] [s2If current_user_can(access_s2member_level1)]
- GBP/USD stays defensive around intraday low after three-day losing streak.
The pair currently trades last at 1.30366.
The previous day high was 1.3126 while the previous day low was 1.3028. The daily 38.2% Fib levels comes at 1.3066, expected to provide resistance. Similarly, the daily 61.8% fib level is at 1.3089, expected to provide resistance.
GBP/USD portrays the pre-data anxiety of the Cable pair traders as it seesaws around 1.3030 amid the early hours of Wednesday’s Asian session, following a three-day downtrend. In doing so, the Pound Sterling prods the bears jostling with the bulls who refreshed the 15-month high in the last week.
Also read: GBP/USD retreats below 1.3100 amid underwhelming US data, looming UK inflation report
That said, the previous day’s downside break of a fortnight-old support line, now immediate resistance around 1.3085, joins the bearish MACD signals to lure the GBP/USD sellers.
However, the 10-week-old resistance-turned-support line joins the 50-SMA to highlight the 1.3000-2985 region as a tough nut to crack for the Cable bears.
In a case where the Cable bears manage to conquer the 1.2985 support, backed by the downbeat UK Consumer Price Index (CPI) for June, the odds of witnessing a slump toward the previous monthly high of around 1.2850 can’t be ruled out.
Meanwhile, GBP/USD recovery needs validation from the support-turned-resistance line surrounding 1.3085 to convince the buyers.
Even so, the weekly resistance line of around 1.3125 and multiple levels marked during late 2021 and early 2022 around 1.3175-80 will restrict the Pound Sterling’s further upside.
Trend: Limited downside expected
Technical Levels: Supports and Resistances
GBPUSD currently trading at 1.3032 at the time of writing. Pair opened at 1.3036 and is trading with a change of -0.03% % .
| Overview | Overview.1 | |
|---|---|---|
| 0 | Today last price | 1.3032 |
| 1 | Today Daily Change | -0.0004 |
| 2 | Today Daily Change % | -0.03% |
| 3 | Today daily open | 1.3036 |
The pair remains strongly bullish on the daily timeframe. It trades above its 20 SMA @ 1.2823, 50 SMA 1.2637, 100 SMA @ 1.2481 and 200 SMA @ 1.2221.
| Trends | Trends.1 | |
|---|---|---|
| 0 | Daily SMA20 | 1.2823 |
| 1 | Daily SMA50 | 1.2637 |
| 2 | Daily SMA100 | 1.2481 |
| 3 | Daily SMA200 | 1.2221 |
The previous day high was 1.3126 while the previous day low was 1.3028. The daily 38.2% Fib levels comes at 1.3066, expected to provide resistance. Similarly, the daily 61.8% fib level is at 1.3089, expected to provide resistance.
Note the levels of interest below:
- Pivot support is noted at 1.3001, 1.2966, 1.2903
- Pivot resistance is noted at 1.3099, 1.3161, 1.3196
| Levels | Levels.1 |
|---|---|
| Previous Daily High | 1.3126 |
| Previous Daily Low | 1.3028 |
| Previous Weekly High | 1.3142 |
| Previous Weekly Low | 1.2750 |
| Previous Monthly High | 1.2848 |
| Previous Monthly Low | 1.2369 |
| Daily Fibonacci 38.2% | 1.3066 |
| Daily Fibonacci 61.8% | 1.3089 |
| Daily Pivot Point S1 | 1.3001 |
| Daily Pivot Point S2 | 1.2966 |
| Daily Pivot Point S3 | 1.2903 |
| Daily Pivot Point R1 | 1.3099 |
| Daily Pivot Point R2 | 1.3161 |
| Daily Pivot Point R3 | 1.3196 |
[/s2If]
Download Nehcap EAWe have two EAs that are operational on our LIVE accounts.
- EA-FIX: Check out the details here. Download EA-FIX . EA-FIX is a non-grid HFT scalper.
- EA-GROWTH: High quality low dd EA using trend grids. Download EA_GROWTHJoin Our Telegram Group
")


