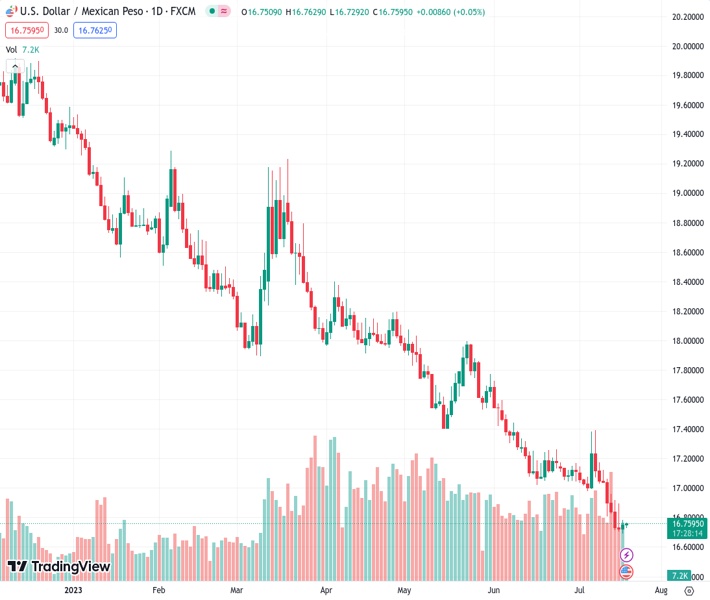
According to @nehcap, the US dollar to Mexican peso exchange rate currently stands at 16.7577. The chart pattern indicates a bullish formation known as a falling wedge, which hasn’t occurred at such low levels since December 2015. However, @nehcap predicts that the recovery will be limited.
…
This is a premium post.
[s2If !current_user_can(access_s2member_level4)]Please register for FREE REGISTER to read full post below containing analysis. In case of any error or you think you are not able to read the full post below, please email us at support#nehcap.com [lwa][/s2If] [s2If current_user_can(access_s2member_level1)]
- USD/MXN portrays falling wedge bullish chart formation at the lowest levels since December 2015.
The pair currently trades last at 16.7577.
The previous day high was 16.783 while the previous day low was 16.6924. The daily 38.2% Fib levels comes at 16.7484, expected to provide support. Similarly, the daily 61.8% fib level is at 16.727, expected to provide support.
USD/MXN grind near intraday high as it prods the key upside hurdle within a bullish chart pattern during early Wednesday, close to 16.75 by the press time.
In doing so, the Mexican Peso (MXN) pair jostles with an upper line of a one-week-old falling wedge bullish formation.
Adding credence to the recovery hopes is the RSI (14) line that portrays higher lows, as well as mark the divergence with the price even when the USD/MXN dropped to a fresh low since December 2015.
With this, the USD/MXN pair is likely to confirm the falling wedge chart pattern by crossing the 16.76 hurdle, which in turn suggests a theoretical target of 17.03.
However, a convergence of the 100-SMA and a descending trend line from July 11, around 16.80 at the latest, appears a tough nut to crack for the pair buyers.
On the contrary, the latest multi-month low marked on Tuesday, around 16.69, precedes the stated wedge’s bottom line of near 16.67 to restrict the short-term downside of the USD/MXN pair.
Following that, the lows marked in December and November of 2015, respectively around 1647 and 16.35, will gain the Mexican Peso pair seller’s attention.
Trend: Limited recovery expected
Technical Levels: Supports and Resistances
USDMXN currently trading at 16.7548 at the time of writing. Pair opened at 16.751 and is trading with a change of 0.02% % .
| Overview | Overview.1 | |
|---|---|---|
| 0 | Today last price | 16.7548 |
| 1 | Today Daily Change | 0.0038 |
| 2 | Today Daily Change % | 0.02% |
| 3 | Today daily open | 16.751 |
The pair remains strongly bearish on the daily time frame. It trades below the 20 SMA @ 17.0304, 50 SMA 17.3112, 100 SMA @ 17.754 and 200 SMA @ 18.5137.
| Trends | Trends.1 | |
|---|---|---|
| 0 | Daily SMA20 | 17.0304 |
| 1 | Daily SMA50 | 17.3112 |
| 2 | Daily SMA100 | 17.7540 |
| 3 | Daily SMA200 | 18.5137 |
The previous day high was 16.783 while the previous day low was 16.6924. The daily 38.2% Fib levels comes at 16.7484, expected to provide support. Similarly, the daily 61.8% fib level is at 16.727, expected to provide support.
Note the levels of interest below:
- Pivot support is noted at 16.7013, 16.6515, 16.6107
- Pivot resistance is noted at 16.7919, 16.8327, 16.8825
| Levels | Levels.1 |
|---|---|
| Previous Daily High | 16.7830 |
| Previous Daily Low | 16.6924 |
| Previous Weekly High | 17.1746 |
| Previous Weekly Low | 16.7167 |
| Previous Monthly High | 17.7286 |
| Previous Monthly Low | 17.0243 |
| Daily Fibonacci 38.2% | 16.7484 |
| Daily Fibonacci 61.8% | 16.7270 |
| Daily Pivot Point S1 | 16.7013 |
| Daily Pivot Point S2 | 16.6515 |
| Daily Pivot Point S3 | 16.6107 |
| Daily Pivot Point R1 | 16.7919 |
| Daily Pivot Point R2 | 16.8327 |
| Daily Pivot Point R3 | 16.8825 |
[/s2If]
Download Nehcap EAWe have two EAs that are operational on our LIVE accounts.
- EA-FIX: Check out the details here. Download EA-FIX . EA-FIX is a non-grid HFT scalper.
- EA-GROWTH: High quality low dd EA using trend grids. Download EA_GROWTHJoin Our Telegram Group
")


