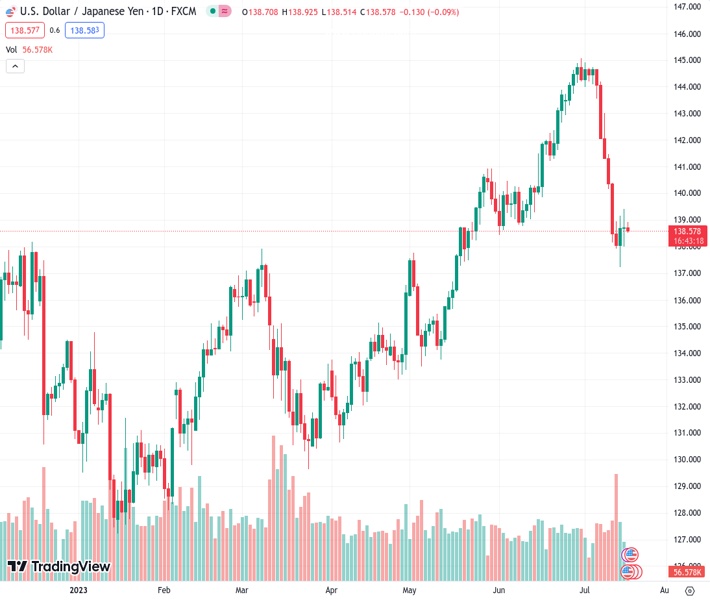
The USDJPY pair, trading at 138.567, is hovering close to its lowest level of the day. It continues to face downward pressure for the second day in a row, following a bounce back from a low point witnessed two months ago.
…
This is a premium post.
[s2If !current_user_can(access_s2member_level4)]Please register for FREE REGISTER to read full post below containing analysis. In case of any error or you think you are not able to read the full post below, please email us at support#nehcap.com [lwa][/s2If] [s2If current_user_can(access_s2member_level1)]
- USD/JPY grinds near intraday low, remains pressured for the second consecutive day after bouncing off two-month low.
The pair currently trades last at 138.567.
The previous day high was 139.41 while the previous day low was 138.0. The daily 38.2% Fib levels comes at 138.54, expected to provide support. Similarly, the daily 61.8% fib level is at 138.87, expected to provide resistance.
USD/JPY holds lower grounds near the intraday bottom surrounding 138.50 amid early Tuesday morning in Europe. In doing so, the Yen pair fades the last Friday’s corrective bounce off the two-month low amid sluggish market conditions. That said, Japanese trader’s return from the holiday failed to infuse the market’s volatility as traders await the US Retail Sales and Industrial Production for June amid mixed feelings.
The risk-barometer pair’s latest weakness portray the markets’ cautious optimism as fears of the US-China tussle recede after the recent efforts from Washington to re-establish relations with Beijing via frequent visit. Additionally, mixed concerns about the global central bankers’ next moves, with the looming Fed rate hike in July, also prod the USD/JPY pair traders.
It should be noted that the Bank of Japan (BoJ) policymakers keep singing the tunes to defend the easy-money policy even if the market players anticipated and exit from ultra-low interest rates and moderation to the Yield Curve Control (YCC) policy.
Elsewhere, Friday’s hawkish Fed concerns couldn’t last long as the previous day’s US data fail to defend the optimism surrounding the world’s largest economy, earlier favored by the top-tier consumer-centric numbers. On Monday, New York (NY) Empire State Manufacturing Index for July eased to 1.1 from 6.6 prior and 0.0 market forecasts. The data failed to inspire the US Dollar Index (DXY) sellers initially before reversing Friday’s recovery, backed by the upbeat prints of the University of Michigan’s (UoM) Consumer Sentiment Index and consumer inflation expectations for July.
It’s worth noting that the market sentiment is also sluggish and hence restricts the immediate moves of the USD/JPY pair. While portraying the mood, the S&P500 Futures dribble at the highest level since April 2022, down 0.10% intraday near 4,565 by the press time, whereas the US 10-year and two-year Treasury bond yields cling to mild losses near $3.80% and 4.73% in that order. It’s worth noting that the US Dollar Index (DXY) remains pressured amid cautious optimism, as well as due to Monday’s downbeat data, whereas commodities and Antipodeans print mild gains of late.
Looking ahead, the US Retail Sales for June, expected to rise to 0.5% versus 0.3% prior, will be crucial to watch for clear directions of the USD/JPY pair. Also important will be the US Industrial Production for June, expected -0.1% versus -0.2% prior, as well as the US-China headlines and the bond market moves as Japan returns from a long weekend.
A failure to cross the previous support line stretched from late March, around 139.50 by the press time, directs USD/JPY bears toward a convergence of the 100 and 200 SMAs near 137.00.
Technical Levels: Supports and Resistances
USDJPY currently trading at 138.59 at the time of writing. Pair opened at 138.72 and is trading with a change of -0.09% % .
| Overview | Overview.1 | |
|---|---|---|
| 0 | Today last price | 138.59 |
| 1 | Today Daily Change | -0.13 |
| 2 | Today Daily Change % | -0.09% |
| 3 | Today daily open | 138.72 |
The pair is trading below its 20 Daily moving average @ 142.35, below its 50 Daily moving average @ 140.22 , above its 100 Daily moving average @ 137.04 and above its 200 Daily moving average @ 137.05
| Trends | Trends.1 | |
|---|---|---|
| 0 | Daily SMA20 | 142.35 |
| 1 | Daily SMA50 | 140.22 |
| 2 | Daily SMA100 | 137.04 |
| 3 | Daily SMA200 | 137.05 |
The previous day high was 139.41 while the previous day low was 138.0. The daily 38.2% Fib levels comes at 138.54, expected to provide support. Similarly, the daily 61.8% fib level is at 138.87, expected to provide resistance.
Note the levels of interest below:
- Pivot support is noted at 138.0, 137.29, 136.59
- Pivot resistance is noted at 139.42, 140.12, 140.83
| Levels | Levels.1 |
|---|---|
| Previous Daily High | 139.41 |
| Previous Daily Low | 138.00 |
| Previous Weekly High | 143.00 |
| Previous Weekly Low | 137.24 |
| Previous Monthly High | 145.07 |
| Previous Monthly Low | 138.43 |
| Daily Fibonacci 38.2% | 138.54 |
| Daily Fibonacci 61.8% | 138.87 |
| Daily Pivot Point S1 | 138.00 |
| Daily Pivot Point S2 | 137.29 |
| Daily Pivot Point S3 | 136.59 |
| Daily Pivot Point R1 | 139.42 |
| Daily Pivot Point R2 | 140.12 |
| Daily Pivot Point R3 | 140.83 |
[/s2If]
Download Nehcap EAWe have two EAs that are operational on our LIVE accounts.
- EA-FIX: Check out the details here. Download EA-FIX . EA-FIX is a non-grid HFT scalper.
- EA-GROWTH: High quality low dd EA using trend grids. Download EA_GROWTHJoin Our Telegram Group
")


