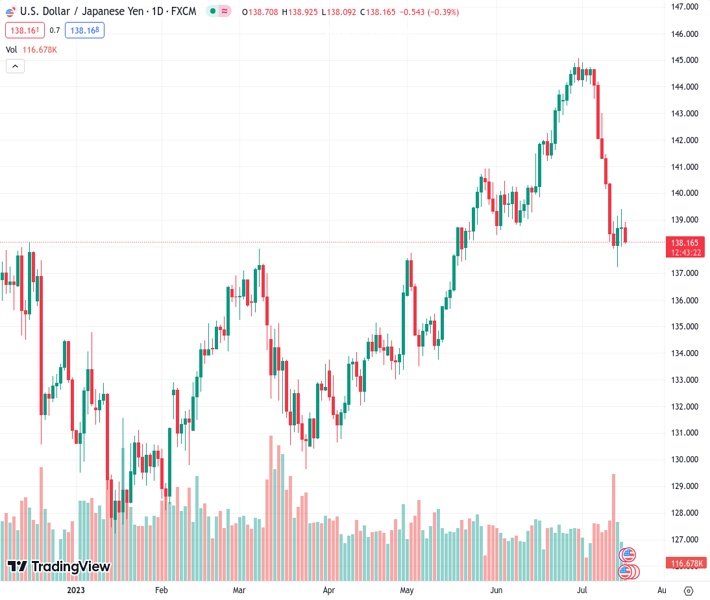
The USDJPY currency pair, trading at a rate of 138.123, encountered new selling pressure on Tuesday due to a renewed bias towards selling the US dollar.
…
This is a premium post.
[s2If !current_user_can(access_s2member_level4)]Please register for FREE REGISTER to read full post below containing analysis. In case of any error or you think you are not able to read the full post below, please email us at support#nehcap.com [lwa][/s2If] [s2If current_user_can(access_s2member_level1)]
- USD/JPY meets with a fresh supply on Tuesday and is pressured by renewed USD selling bias.
The pair currently trades last at 138.123.
The previous day high was 139.41 while the previous day low was 138.0. The daily 38.2% Fib levels comes at 138.54, expected to provide resistance. Similarly, the daily 61.8% fib level is at 138.87, expected to provide resistance.
The USD/JPY pair attracts some sellers in the vicinity of the 139.00 mark on Tuesday and extends its steady intraday descent through the early part of the European session. The pair drops to a fresh daily low, around the 138.20-138.15 region in the last hour and is pressured by a combination of factors.
The US Dollar (USD) continues with its struggle to register any meaningful recovery and languishes near its lowest level since April 2022 touched last Friday in the wake of expectations that the Federal Reserve (Fed) will soften its hawkish stance. The markets seem convinced that the US central bank will end its policy tightening campaign after the widely anticipated 25 bps lift-off at its upcoming policy meeting on July 25-26. This leads to a further decline in the US Treasury bond yields, which is seen weighing on the Greenback and dragging the USD/JPY pair lower.
The Japanese Yen (JPY), on the other hand, draws some support from speculations that the Bank of Japan (BoJ) could adjust its Yield Curve Control (YCC) policy in July. It is worth recalling, Japanese media reported that the BoJ is likely to raise its FY2023 inflation forecast, which has exceeded the 2% goal for more than a year. This should put pressure on the central bank to start unwinding its ultra-loose monetary policy settings. Apart from this, the prevalent cautious mood further benefits the safe-haven JPY and contributes to the offered tone surrounding the USD/JPY pair.
The market sentiment remains fragile on the back of growing worries about a global economic slowdown. The fears were fueled by weaker Chinese macro data released on Monday, which suggested that the post-COVID recovery is losing steam. In fact, the National Bureau of Statistics of China reported on Monday that the economic growth decelerated substantially in the second quarter and Retail sales – a gauge of consumption – slowed sharply in June. That said, the possibility of more stimulus measures from China helps limit the pessimism in the markets, at least for now.
Furthermore, doubts that the Fed will commit to a more dovish policy stance, instead might stick to its forecast for a 50 bps rate hike this year might hold back traders from placing aggressive bearish bets around the USD. This, in turn, warrants some caution before positioning for an extension of the USD/JPY pair’s recent sharp retracement slide from the YTD peak – levels just above the 145.00 psychological mark – touched in June. Investors now look to the release of the US monthly Retail Sales and Industrial Production figures for short-term trading opportunities.
Technical Levels: Supports and Resistances
USDJPY currently trading at 138.23 at the time of writing. Pair opened at 138.72 and is trading with a change of -0.35 % .
| Overview | Overview.1 | |
|---|---|---|
| 0 | Today last price | 138.23 |
| 1 | Today Daily Change | -0.49 |
| 2 | Today Daily Change % | -0.35 |
| 3 | Today daily open | 138.72 |
The pair is trading below its 20 Daily moving average @ 142.35, below its 50 Daily moving average @ 140.22 , above its 100 Daily moving average @ 137.04 and above its 200 Daily moving average @ 137.05
| Trends | Trends.1 | |
|---|---|---|
| 0 | Daily SMA20 | 142.35 |
| 1 | Daily SMA50 | 140.22 |
| 2 | Daily SMA100 | 137.04 |
| 3 | Daily SMA200 | 137.05 |
The previous day high was 139.41 while the previous day low was 138.0. The daily 38.2% Fib levels comes at 138.54, expected to provide resistance. Similarly, the daily 61.8% fib level is at 138.87, expected to provide resistance.
Note the levels of interest below:
- Pivot support is noted at 138.0, 137.29, 136.59
- Pivot resistance is noted at 139.42, 140.12, 140.83
| Levels | Levels.1 |
|---|---|
| Previous Daily High | 139.41 |
| Previous Daily Low | 138.00 |
| Previous Weekly High | 143.00 |
| Previous Weekly Low | 137.24 |
| Previous Monthly High | 145.07 |
| Previous Monthly Low | 138.43 |
| Daily Fibonacci 38.2% | 138.54 |
| Daily Fibonacci 61.8% | 138.87 |
| Daily Pivot Point S1 | 138.00 |
| Daily Pivot Point S2 | 137.29 |
| Daily Pivot Point S3 | 136.59 |
| Daily Pivot Point R1 | 139.42 |
| Daily Pivot Point R2 | 140.12 |
| Daily Pivot Point R3 | 140.83 |
[/s2If]
Download Nehcap EAWe have two EAs that are operational on our LIVE accounts.
- EA-FIX: Check out the details here. Download EA-FIX . EA-FIX is a non-grid HFT scalper.
- EA-GROWTH: High quality low dd EA using trend grids. Download EA_GROWTHJoin Our Telegram Group
")


