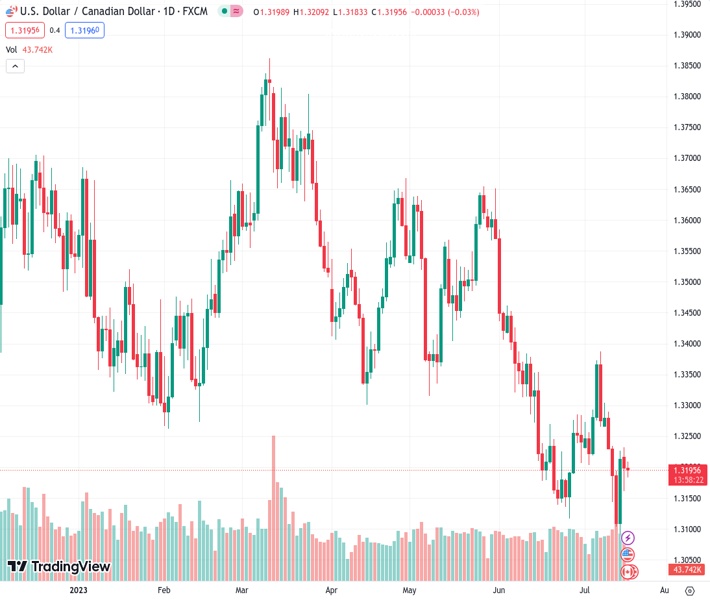
The USDCAD currency pair is holding onto an important Fibonacci retracement level within a bearish channel that has been in place for multiple days. According to the view of nehcap, they anticipate that there will be minimal upward movement.
…
This is a premium post.
[s2If !current_user_can(access_s2member_level4)]Please register for FREE REGISTER to read full post below containing analysis. In case of any error or you think you are not able to read the full post below, please email us at support#nehcap.com [lwa][/s2If] [s2If current_user_can(access_s2member_level1)]
- USD/CAD clings to key Fibonacci retracement level within multi-day-old bearish channel.
The pair currently trades last at 1.31962.
The previous day high was 1.3232 while the previous day low was 1.3161. The daily 38.2% Fib levels comes at 1.3188, expected to provide support. Similarly, the daily 61.8% fib level is at 1.3205, expected to provide resistance.
USD/CAD portrays the typical pre-data inaction around 1.3200 heading into Tuesday’s European session. In doing so, the Loonie pair makes rounds to the 61.8% Fibonacci retracement of its August-October upside while holding lower grounds within a four-month-old bearish trend channel.
That said, the quote’s failure to cross the 21-DMA hurdle, around 1.3225 by the press time, joins the steady RSI (14) line to suggest further grinding of the USD/CAD prices toward the south.
However, the bottom line of the aforementioned descending channel, around 1.3100 by the press time, appears a tough nut to crack for the USD/CAD bears.
In a case where the USD/CAD price drops below 1.3100, the 1.3000 psychological magnet and the 78.6% Fibonacci retracement near 1.2990 could attract the sellers.
Meanwhile, an upside break of the 21-DMA resistance of near 1.3225 can propel the USD/CAD toward a downward-sloping resistance line from May 31, close to 1.3285.
Following that, a convergence of the 50-DMA and 50% Fibonacci retracement, around 1.3350, will be crucial to watch for the USD/CAD bulls to retake control.
Fundamentally, Canada’s headline Consumer Price Index (CPI), Bank of Canada CPI and the US Retail Sales for June will be important to watch for clear directions of the Loonie pair.
Also read: USD/CAD Outlook: Traders seem non-committed near 1.3200 ahead of Canadian CPI, US Retail Sales
Trend: Limited upside expected
Technical Levels: Supports and Resistances
USDCAD currently trading at 1.3199 at the time of writing. Pair opened at 1.3199 and is trading with a change of 0.00% % .
| Overview | Overview.1 | |
|---|---|---|
| 0 | Today last price | 1.3199 |
| 1 | Today Daily Change | 0.0000 |
| 2 | Today Daily Change % | 0.00% |
| 3 | Today daily open | 1.3199 |
The pair remains strongly bearish on the daily time frame. It trades below the 20 SMA @ 1.3223, 50 SMA 1.3355, 100 SMA @ 1.3468 and 200 SMA @ 1.3489.
| Trends | Trends.1 | |
|---|---|---|
| 0 | Daily SMA20 | 1.3223 |
| 1 | Daily SMA50 | 1.3355 |
| 2 | Daily SMA100 | 1.3468 |
| 3 | Daily SMA200 | 1.3489 |
The previous day high was 1.3232 while the previous day low was 1.3161. The daily 38.2% Fib levels comes at 1.3188, expected to provide support. Similarly, the daily 61.8% fib level is at 1.3205, expected to provide resistance.
Note the levels of interest below:
- Pivot support is noted at 1.3163, 1.3126, 1.3091
- Pivot resistance is noted at 1.3234, 1.3269, 1.3305
| Levels | Levels.1 |
|---|---|
| Previous Daily High | 1.3232 |
| Previous Daily Low | 1.3161 |
| Previous Weekly High | 1.3304 |
| Previous Weekly Low | 1.3093 |
| Previous Monthly High | 1.3585 |
| Previous Monthly Low | 1.3117 |
| Daily Fibonacci 38.2% | 1.3188 |
| Daily Fibonacci 61.8% | 1.3205 |
| Daily Pivot Point S1 | 1.3163 |
| Daily Pivot Point S2 | 1.3126 |
| Daily Pivot Point S3 | 1.3091 |
| Daily Pivot Point R1 | 1.3234 |
| Daily Pivot Point R2 | 1.3269 |
| Daily Pivot Point R3 | 1.3305 |
[/s2If]
Download Nehcap EAWe have two EAs that are operational on our LIVE accounts.
- EA-FIX: Check out the details here. Download EA-FIX . EA-FIX is a non-grid HFT scalper.
- EA-GROWTH: High quality low dd EA using trend grids. Download EA_GROWTHJoin Our Telegram Group
")


