The US Dollar to Mexican Peso exchange rate falls to a new low for the year at 16.7181 as a result of disappointing data indicating lower US Retail Sales and industrial production.
…
This is a premium post.
[s2If !current_user_can(access_s2member_level4)]Please register for FREE REGISTER to read full post below containing analysis. In case of any error or you think you are not able to read the full post below, please email us at support#nehcap.com [lwa][/s2If] [s2If current_user_can(access_s2member_level1)]
- USD/MXN sinks to a fresh yearly low of 16.7181 amid weaker-than-expected US Retail Sales and industrial production figures.
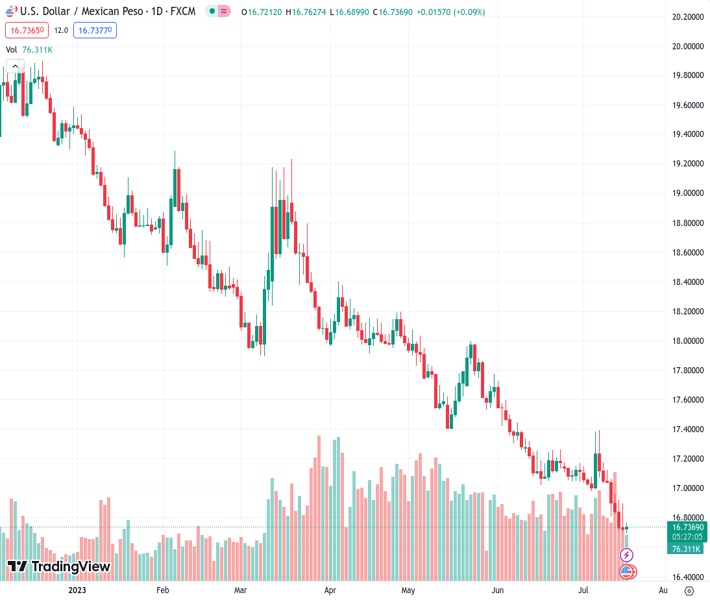
The pair currently trades last at 16.7361.
The previous day high was 16.8984 while the previous day low was 16.7068. The daily 38.2% Fib levels comes at 16.78, expected to provide resistance. Similarly, the daily 61.8% fib level is at 16.8252, expected to provide resistance.
USD/MXN tumbled to fresh yearly lows of 17.6899 early in the North American session after the greenback (USD) softened amidst the US Department of Commerce revealed June’s Retail Sales report. The USD/MXN is trading at 16.7181, with losses of 0.03%.
Key economic data revealed before Wall Street opened exacerbated the USD/MXN’s fall toward new yearly lows. US Retail Sales for June rose by 0.2% MoM, below estimates of 0.5%, while excluding autos, the so-called core Retail Sales missed the 0.3% forecasts and jumped by a modest 0.2% MoM. In other data revealed by the US Federal Reserve (Fed), industrial Production tanked, with monthly figures sliding -0.5% MoM, below estimates of 0%. At the same time, annually based, market participants projected a 1.1% expansion, though data plunged -0.4 percent in data revealed from June.
Following the data release, the USD/MXN continued to trend lower while the buck remained defensive. The US Dollar Index (DXY), a gauge of the US Dollar against a basket of peers, stands at 99.817, down 0.07%.
US Treasury bond yields dropped as the US 2-year Treasury note yields 4.715%, three basis points below its opening price. The 10-year benchmark note sits at 3.760% and slides five basis points.
The agenda in Mexico remained empty, with Retail Sales expected to be released on Thursday. Annually figures for May are expected to decelerate from 3.8% to 3.5%, while for monthly numbers, analysts foresee a deeper slowdown to 0.3% from April’s 1.5%.
Given the backdrop, the USD/MXN bias remains tilted downwards, though the overextended fall could find some support at around the 16.30/50 area if the current YTD low is broken. The interest rate differential favors the Mexican Peso (MXN) vs. the US Dollar (USD). But any US inflation surprises, or a risk of a ‘hard landing’ increasing in the US, could spur a flight to safety, weighing on the emerging market currency.
The daily chart shows the USD/MXN as poised to the downside. The Relative Strength Index (RSI) indicator remains at oversold territory, with no intentions to get back above the 30 levels, while the three-day Rate of Change (RoC) portrays sellers jumping in after flashing signs of selling pressure abating. Nevertheless, selling pressure remains weaker than the prior’s day, as revealed by the RoC. That said, the USD/MXN first support emerges at 16.5000, followed by the confluence of the 200-month EMA at 16.3000, nearby the October 2015 swing low of 16.3267. On the flip side, the USD/MXN first resistance would be the 20-day EMA at 17.0032.
Technical Levels: Supports and Resistances
USDMXN currently trading at 16.7228 at the time of writing. Pair opened at 16.7274 and is trading with a change of -0.03 % .
| Overview | Overview.1 | |
|---|---|---|
| 0 | Today last price | 16.7228 |
| 1 | Today Daily Change | -0.0046 |
| 2 | Today Daily Change % | -0.0300 |
| 3 | Today daily open | 16.7274 |
The pair remains strongly bearish on the daily time frame. It trades below the 20 SMA @ 17.0536, 50 SMA 17.3317, 100 SMA @ 17.7695 and 200 SMA @ 18.5304.
| Trends | Trends.1 | |
|---|---|---|
| 0 | Daily SMA20 | 17.0536 |
| 1 | Daily SMA50 | 17.3317 |
| 2 | Daily SMA100 | 17.7695 |
| 3 | Daily SMA200 | 18.5304 |
The previous day high was 16.8984 while the previous day low was 16.7068. The daily 38.2% Fib levels comes at 16.78, expected to provide resistance. Similarly, the daily 61.8% fib level is at 16.8252, expected to provide resistance.
Note the levels of interest below:
- Pivot support is noted at 16.6567, 16.586, 16.4652
- Pivot resistance is noted at 16.8482, 16.969, 17.0397
| Levels | Levels.1 |
|---|---|
| Previous Daily High | 16.8984 |
| Previous Daily Low | 16.7068 |
| Previous Weekly High | 17.1746 |
| Previous Weekly Low | 16.7167 |
| Previous Monthly High | 17.7286 |
| Previous Monthly Low | 17.0243 |
| Daily Fibonacci 38.2% | 16.7800 |
| Daily Fibonacci 61.8% | 16.8252 |
| Daily Pivot Point S1 | 16.6567 |
| Daily Pivot Point S2 | 16.5860 |
| Daily Pivot Point S3 | 16.4652 |
| Daily Pivot Point R1 | 16.8482 |
| Daily Pivot Point R2 | 16.9690 |
| Daily Pivot Point R3 | 17.0397 |
[/s2If]
Download Nehcap EAWe have two EAs that are operational on our LIVE accounts.
- EA-FIX: Check out the details here. Download EA-FIX . EA-FIX is a non-grid HFT scalper.
- EA-GROWTH: High quality low dd EA using trend grids. Download EA_GROWTHJoin Our Telegram Group
")


