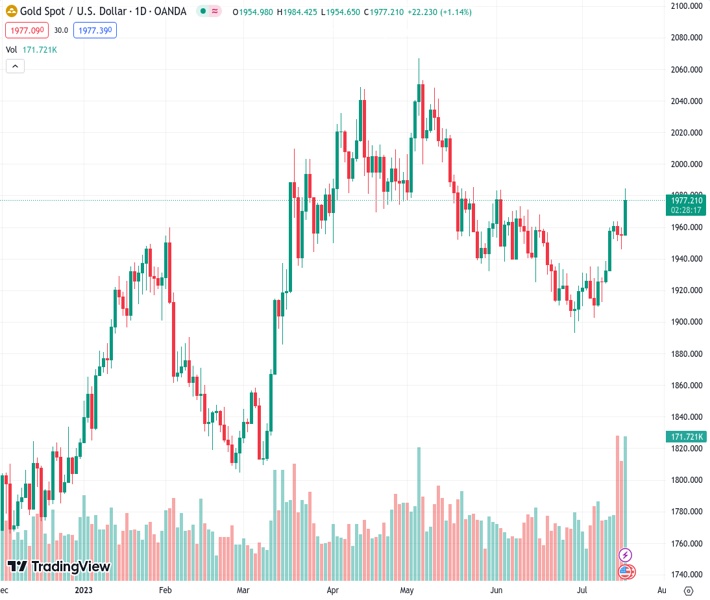
The price of gold against the US dollar, known as XAUUSD, increased close to $1,980, reaching its highest point since June 2nd.
…
This is a premium post.
[s2If !current_user_can(access_s2member_level4)]Please register for FREE REGISTER to read full post below containing analysis. In case of any error or you think you are not able to read the full post below, please email us at support#nehcap.com [lwa][/s2If] [s2If current_user_can(access_s2member_level1)]
- XAU/USD advanced near $1,980, its highest since June 2.
The pair currently trades last at 1977.47.
The previous day high was 1959.92 while the previous day low was 1945.85. The daily 38.2% Fib levels comes at 1951.22, expected to provide support. Similarly, the daily 61.8% fib level is at 1954.55, expected to provide support.
On Tuesday, the XAU/USD advanced towards $1,980 and displayed more than 1% gains. In that sense, as the Retail Sales hint at a decelerating US economy, US Treasury yields declined across the board, favouring the yellow metal’s price.
The US Census Bureau reported that the Retail Sales from June increased by 0.2%, lower than the 0.5% expected and the previous 0.5% monthly increase. Sales excluding the Automobile Sector also expanded but below the expectations at 0.2% vs the 0.3% expected by the Retail Sales Control Group, came in strong at 0.6% vs the 0.3% decline expected.
As a reaction, US yields are retreating, with the 2-year yield standing at 4.72%, while the 5 and 10-year rates fell to 3.97% and 3.77%, respectively, with the latter leading a decline showing more than 1% decreases. As US yields are the opportunity cost of holding non-yielding metals, their decline is tractioning the XAU/USD.
Focus now shifts to next week’s Federal Reserve (Fed) decision, where markets have nearly priced in a 25 basis point (bps) hike. Due to soft inflation and weak Retail Sales, investors are now refraining from betting on an additional hike past July. Market participants will closely watch the Fed’s statement and Jerome Powell’s outlook for clues regarding forward guidance.
After consolidating above the 100-day Simple Moving Average (SMA) at $1,956, the XAU/USD outlook is bullish for the short term. In addition, the Relative Strength Index (RSI) stands with a positive slope above its midline. At the same time, the Moving Average Convergence Divergence (MACD) prints higher green bars suggesting that the bulls are in command.
Resistance levels: $1,985, $2,000, $2,010.
Support levels: $1,956 (100-day SMA), $1,940, $1,930 (20-day SMA).
Technical Levels: Supports and Resistances
XAUUSD currently trading at 1975.87 at the time of writing. Pair opened at 1955.12 and is trading with a change of 1.06 % .
| Overview | Overview.1 | |
|---|---|---|
| 0 | Today last price | 1975.87 |
| 1 | Today Daily Change | 20.75 |
| 2 | Today Daily Change % | 1.06 |
| 3 | Today daily open | 1955.12 |
The pair remains strongly bullish on the daily timeframe. It trades above its 20 SMA @ 1927.99, 50 SMA 1953.18, 100 SMA @ 1955.08 and 200 SMA @ 1873.71.
| Trends | Trends.1 | |
|---|---|---|
| 0 | Daily SMA20 | 1927.99 |
| 1 | Daily SMA50 | 1953.18 |
| 2 | Daily SMA100 | 1955.08 |
| 3 | Daily SMA200 | 1873.71 |
The previous day high was 1959.92 while the previous day low was 1945.85. The daily 38.2% Fib levels comes at 1951.22, expected to provide support. Similarly, the daily 61.8% fib level is at 1954.55, expected to provide support.
Note the levels of interest below:
- Pivot support is noted at 1947.34, 1939.56, 1933.27
- Pivot resistance is noted at 1961.41, 1967.7, 1975.48
| Levels | Levels.1 |
|---|---|
| Previous Daily High | 1959.92 |
| Previous Daily Low | 1945.85 |
| Previous Weekly High | 1963.82 |
| Previous Weekly Low | 1912.74 |
| Previous Monthly High | 1983.50 |
| Previous Monthly Low | 1893.01 |
| Daily Fibonacci 38.2% | 1951.22 |
| Daily Fibonacci 61.8% | 1954.55 |
| Daily Pivot Point S1 | 1947.34 |
| Daily Pivot Point S2 | 1939.56 |
| Daily Pivot Point S3 | 1933.27 |
| Daily Pivot Point R1 | 1961.41 |
| Daily Pivot Point R2 | 1967.70 |
| Daily Pivot Point R3 | 1975.48 |
[/s2If]
Download Nehcap EAWe have two EAs that are operational on our LIVE accounts.
- EA-FIX: Check out the details here. Download EA-FIX . EA-FIX is a non-grid HFT scalper.
- EA-GROWTH: High quality low dd EA using trend grids. Download EA_GROWTHJoin Our Telegram Group
")


