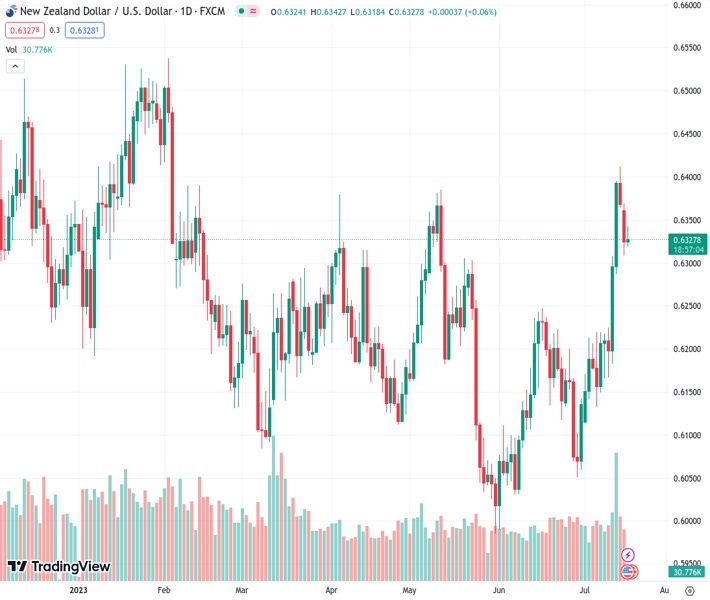
The NZDUSD pair showed a slight increase in value during the Asian session on Tuesday at a rate of 0.63270, but the momentum was not sustained.
…
This is a premium post.
[s2If !current_user_can(access_s2member_level4)]Please register for FREE REGISTER to read full post below containing analysis. In case of any error or you think you are not able to read the full post below, please email us at support#nehcap.com [lwa][/s2If] [s2If current_user_can(access_s2member_level1)]
- NZD/USD edges higher during the Asian session on Tuesday, albeit lacks follow-through.
The pair currently trades last at 0.63270.
The previous day high was 0.637 while the previous day low was 0.6308. The daily 38.2% Fib levels comes at 0.6332, expected to provide resistance. Similarly, the daily 61.8% fib level is at 0.6346, expected to provide resistance.
The NZD/USD pair manages to defend the 0.6300 mark and attracts some buying during the Asian session on Tuesday, stalling its retracement slide from levels just above the 0.6400 round figure or the highest since early February touched last week. Spot prices currently trade just below mid-0.6200s, up nearly 0.30% for the day and draw support from a modest US Dollar (USD) downtick.
In fact, the USD Index (DXY), which tracks the Greenback against a basket of currencies, remains well within the striking distance of a 15-month low set last Friday and continues to be undermined by rising bets for a less hawkish Federal Reserve (Fed). Investors now seem convinced that the US central bank is nearing the end of its policy tightening cycles and have been pricing out the possibility of any further rate hikes this year, following the expected 25 bps lift-off in July. This had led to the recent pullback in the US Treasury bond yields and keeps the USD bulls on the defensive.
Apart from this, a generally positive risk tone is seen as another factor weighing on the safe-haven buck and lending some support to the risk-sensitive Kiwi. Meanwhile, the weaker Chinese GDP print released on Monday adds to worries about a global economic downturn and might cap any optimism in the markets. Furthermore, expectations that the Fed might stick to its forecast for a 50 bps rate hike this year might hold back traders from placing aggressive bearish bets around the USD. This, in turn, should keep a lid on any meaningful appreciating move for the NZD/USD pair.
Market participants now look forward to the US economic docket, featuring the release of monthly Retail Sales and Industrial Production figures later during the early North American session. This, along with the US bond yields and the broader risk sentiment, might influence the USD and provide some impetus to the NZD/USD pair. The aforementioned fundamental backdrop, meanwhile, makes it prudent to wait for some follow-through buying before confirming that the recent pullback from a multi-month high has run its course and placing fresh bullish bets around the pair.
Technical Levels: Supports and Resistances
NZDUSD currently trading at 0.6342 at the time of writing. Pair opened at 0.6324 and is trading with a change of 0.28 % .
| Overview | Overview.1 | |
|---|---|---|
| 0 | Today last price | 0.6342 |
| 1 | Today Daily Change | 0.0018 |
| 2 | Today Daily Change % | 0.2800 |
| 3 | Today daily open | 0.6324 |
The pair remains strongly bullish on the daily timeframe. It trades above its 20 SMA @ 0.6196, 50 SMA 0.6175, 100 SMA @ 0.6194 and 200 SMA @ 0.6193.
| Trends | Trends.1 | |
|---|---|---|
| 0 | Daily SMA20 | 0.6196 |
| 1 | Daily SMA50 | 0.6175 |
| 2 | Daily SMA100 | 0.6194 |
| 3 | Daily SMA200 | 0.6193 |
The previous day high was 0.637 while the previous day low was 0.6308. The daily 38.2% Fib levels comes at 0.6332, expected to provide resistance. Similarly, the daily 61.8% fib level is at 0.6346, expected to provide resistance.
Note the levels of interest below:
- Pivot support is noted at 0.6298, 0.6272, 0.6236
- Pivot resistance is noted at 0.636, 0.6396, 0.6422
| Levels | Levels.1 |
|---|---|
| Previous Daily High | 0.6370 |
| Previous Daily Low | 0.6308 |
| Previous Weekly High | 0.6413 |
| Previous Weekly Low | 0.6166 |
| Previous Monthly High | 0.6250 |
| Previous Monthly Low | 0.5990 |
| Daily Fibonacci 38.2% | 0.6332 |
| Daily Fibonacci 61.8% | 0.6346 |
| Daily Pivot Point S1 | 0.6298 |
| Daily Pivot Point S2 | 0.6272 |
| Daily Pivot Point S3 | 0.6236 |
| Daily Pivot Point R1 | 0.6360 |
| Daily Pivot Point R2 | 0.6396 |
| Daily Pivot Point R3 | 0.6422 |
[/s2If]
Download Nehcap EAWe have two EAs that are operational on our LIVE accounts.
- EA-FIX: Check out the details here. Download EA-FIX . EA-FIX is a non-grid HFT scalper.
- EA-GROWTH: High quality low dd EA using trend grids. Download EA_GROWTHJoin Our Telegram Group
")


