The GBPUSD currency pair, trading at a level of 1.30344, declined by 0.13% due to underwhelming figures from US retail sales and industrial production, as well as an uncertain US economic future.
…
This is a premium post.
[s2If !current_user_can(access_s2member_level4)]Please register for FREE REGISTER to read full post below containing analysis. In case of any error or you think you are not able to read the full post below, please email us at support#nehcap.com [lwa][/s2If] [s2If current_user_can(access_s2member_level1)]
- GBP/USD slides 0.13%, pulled down by disappointing US retail sales and industrial production data, alongside the uncertain US economic outlook.
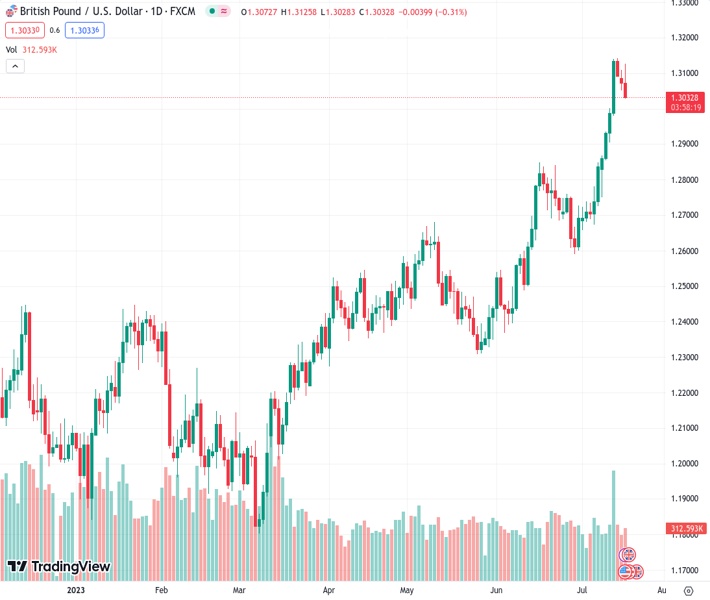
The pair currently trades last at 1.30344.
The previous day high was 1.3109 while the previous day low was 1.3051. The daily 38.2% Fib levels comes at 1.3073, expected to provide resistance. Similarly, the daily 61.8% fib level is at 1.3087, expected to provide resistance.
GBP/USD struggles at 1.3100 and retreats as the United States (US) economy continued to show signs of weakening, suggested by not-so-good economic data revealed on early Tuesday. In addition, the United Kingdom (UK) inflation report, just around the corner, is set to keep the GBP/USD pair within familiar levels. At the time of writing, the GBP/USD is trading at 1.3055, down 0.13%.
The latest data on US retail sales for June showed a modest increase of 0.2% compared to the previous month, falling short of the estimated growth of 0.5%. When excluding automobile sales, often referred to as core retail sales, the figures also missed forecasts, with a modest 0.2% month-on-month increase compared to the anticipated 0.3%. In addition, the US Federal Reserve released data on industrial production, which experienced a significant decline. Monthly figures showed a slide of -0.5% compared to the previous month, below the expected 0% growth. On an annual basis, market participants had projected a 1.1% expansion, but the data revealed a decline of -0.4% for June.
Across the pond, the UK’s economic docket will feature the release of the Consumer Price Index (CPI) for June. Market participants estimate CPI would fall to 8.2% YoY, below May’s 8.7%. Core CPI is projected to stay steady at 7.1% YoY. If inflation exceeds estimates, that could pave the way for further tightening by the Bank of England (BoE). Otherwise, it could ease pressure on the BoE, which remains under stress, as it has failed to provide price stability after the Covid-19 pandemic.
Initially, the US Dollar weakened on the release. As of late, it’s recovering lost ground as depicted by the US Dollar Index, which tracks the performance of six currencies vs. the US Dollar, which stands at 99.952 and gains 0.07%.
Despite that, ING analysts estimate the GBP/USD could aime towards 1.33 in the near term. Nevertheless, they noted that “a soft inflation print could hurt” the Sterling (GBP) prospects and stir a drop in the GBP/USD. Regarding monetary policy, they wrote, “At the moment, we look for two more BoE rate hikes – policy rate to 5.50% – but well below the 6%+ rates priced by the markets.”
The GBP/USD daily chart portrays the pair as upward biased but on an ongoing correction after hitting a year-to-date (YTD) high of 1.3142, in addition to the Relative Strength Index (RSI) indicator exiting from overbought territory. That, alongside the three-day Rate of Change (RoC) depicting sellers gathering momentum, opens the door for the pullback. The GBP/USD first support would be the 38.2% Fibonacci (Fibo) retracement at 1.2962. A breach of the latter will expose the 50% Fibo retracement at 1.2906, followed by the confluence of the June 16 high and the 61.8% Fibo at around 1.2848/51. Contrarily, the GBPUSD fist resistance would be 1.3100, followed by the YTD high at 1.3142.
Technical Levels: Supports and Resistances
GBPUSD currently trading at 1.3045 at the time of writing. Pair opened at 1.3073 and is trading with a change of -0.21 % .
| Overview | Overview.1 | |
|---|---|---|
| 0 | Today last price | 1.3045 |
| 1 | Today Daily Change | -0.0028 |
| 2 | Today Daily Change % | -0.2100 |
| 3 | Today daily open | 1.3073 |
The pair remains strongly bullish on the daily timeframe. It trades above its 20 SMA @ 1.2809, 50 SMA 1.2629, 100 SMA @ 1.2471 and 200 SMA @ 1.2211.
| Trends | Trends.1 | |
|---|---|---|
| 0 | Daily SMA20 | 1.2809 |
| 1 | Daily SMA50 | 1.2629 |
| 2 | Daily SMA100 | 1.2471 |
| 3 | Daily SMA200 | 1.2211 |
The previous day high was 1.3109 while the previous day low was 1.3051. The daily 38.2% Fib levels comes at 1.3073, expected to provide resistance. Similarly, the daily 61.8% fib level is at 1.3087, expected to provide resistance.
Note the levels of interest below:
- Pivot support is noted at 1.3046, 1.302, 1.2988
- Pivot resistance is noted at 1.3105, 1.3136, 1.3163
| Levels | Levels.1 |
|---|---|
| Previous Daily High | 1.3109 |
| Previous Daily Low | 1.3051 |
| Previous Weekly High | 1.3142 |
| Previous Weekly Low | 1.2750 |
| Previous Monthly High | 1.2848 |
| Previous Monthly Low | 1.2369 |
| Daily Fibonacci 38.2% | 1.3073 |
| Daily Fibonacci 61.8% | 1.3087 |
| Daily Pivot Point S1 | 1.3046 |
| Daily Pivot Point S2 | 1.3020 |
| Daily Pivot Point S3 | 1.2988 |
| Daily Pivot Point R1 | 1.3105 |
| Daily Pivot Point R2 | 1.3136 |
| Daily Pivot Point R3 | 1.3163 |
[/s2If]
Download Nehcap EAWe have two EAs that are operational on our LIVE accounts.
- EA-FIX: Check out the details here. Download EA-FIX . EA-FIX is a non-grid HFT scalper.
- EA-GROWTH: High quality low dd EA using trend grids. Download EA_GROWTHJoin Our Telegram Group
")


