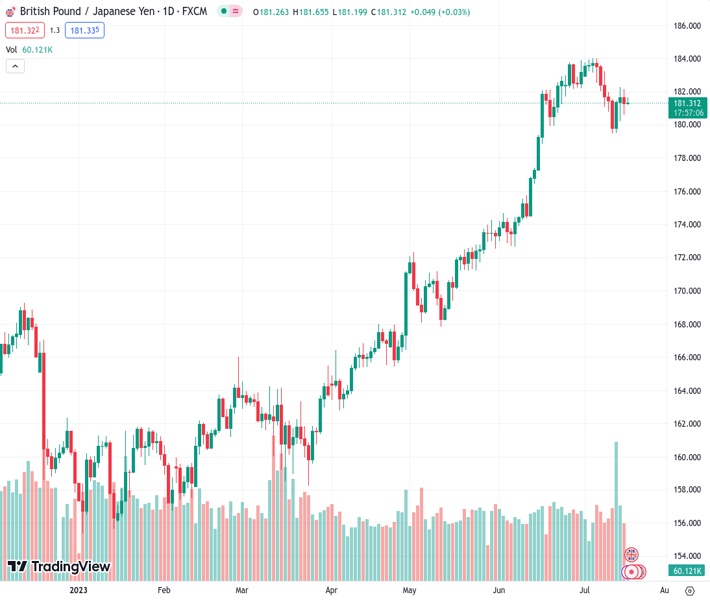
The GBPJPY pair at a price of 181.334 continues to show uncertainty within its important trading range and is losing the gains it made last week. According to the view of @nehcap, a small amount of downward movement is anticipated.
…
This is a premium post.
[s2If !current_user_can(access_s2member_level4)]Please register for FREE REGISTER to read full post below containing analysis. In case of any error or you think you are not able to read the full post below, please email us at support#nehcap.com [lwa][/s2If] [s2If current_user_can(access_s2member_level1)]
- GBP/JPY remains indecisive within the key trading range, fades previous week’s recovery.
The pair currently trades last at 181.334.
The previous day high was 182.15 while the previous day low was 180.58. The daily 38.2% Fib levels comes at 181.18, expected to provide support. Similarly, the daily 61.8% fib level is at 181.55, expected to provide resistance.
GBP/JPY seesaws around 181.30-40 as it struggles to defend the week-start losses, as well as fade the previous week’s rebound, amid early Tuesday morning in Europe. In doing so, the cross-currency pair portrays the market’s indecision ahead of the top-tier UK data.
That said, the GBP/JPY pair’s recovery from an upward-sloping trend line from May 11 failed to cross the one-month-long horizontal area comprising the 100-SMA.
The quote’s failure to cross the key resistance region surrounding 182.15-40 joins the impending bear cross on the MACD and the steady RSI (14) line to lure the GBP/JPY sellers in marking another attempt to break the multi-day-old support line, close to 180.30 at the latest.
However, the 180.00 psychological magnet and the 200-SMA level of around 179.90 can test the bears before giving them control. Also acting as a downside filter is the monthly low of near 179.45.
Meanwhile, the GBP/JPY pair’s upside clearance of the 182.40 hurdle will target the yearly top of around 184.00 resistance.
Following that, July 2015 low near 185.00 may test the bulls ahead of directing them to the 190.00 threshold.
Trend: Limited downside expected
Technical Levels: Supports and Resistances
GBPJPY currently trading at 181.41 at the time of writing. Pair opened at 181.35 and is trading with a change of 0.03% % .
| Overview | Overview.1 | |
|---|---|---|
| 0 | Today last price | 181.41 |
| 1 | Today Daily Change | 0.06 |
| 2 | Today Daily Change % | 0.03% |
| 3 | Today daily open | 181.35 |
The pair is trading below its 20 Daily moving average @ 182.31, above its 50 Daily moving average @ 177.09 , above its 100 Daily moving average @ 170.95 and above its 200 Daily moving average @ 167.28
| Trends | Trends.1 | |
|---|---|---|
| 0 | Daily SMA20 | 182.31 |
| 1 | Daily SMA50 | 177.09 |
| 2 | Daily SMA100 | 170.95 |
| 3 | Daily SMA200 | 167.28 |
The previous day high was 182.15 while the previous day low was 180.58. The daily 38.2% Fib levels comes at 181.18, expected to provide support. Similarly, the daily 61.8% fib level is at 181.55, expected to provide resistance.
Note the levels of interest below:
- Pivot support is noted at 180.57, 179.79, 178.99
- Pivot resistance is noted at 182.14, 182.93, 183.71
| Levels | Levels.1 |
|---|---|
| Previous Daily High | 182.15 |
| Previous Daily Low | 180.58 |
| Previous Weekly High | 183.23 |
| Previous Weekly Low | 179.47 |
| Previous Monthly High | 183.88 |
| Previous Monthly Low | 172.67 |
| Daily Fibonacci 38.2% | 181.18 |
| Daily Fibonacci 61.8% | 181.55 |
| Daily Pivot Point S1 | 180.57 |
| Daily Pivot Point S2 | 179.79 |
| Daily Pivot Point S3 | 178.99 |
| Daily Pivot Point R1 | 182.14 |
| Daily Pivot Point R2 | 182.93 |
| Daily Pivot Point R3 | 183.71 |
[/s2If]
Download Nehcap EAWe have two EAs that are operational on our LIVE accounts.
- EA-FIX: Check out the details here. Download EA-FIX . EA-FIX is a non-grid HFT scalper.
- EA-GROWTH: High quality low dd EA using trend grids. Download EA_GROWTHJoin Our Telegram Group
")


