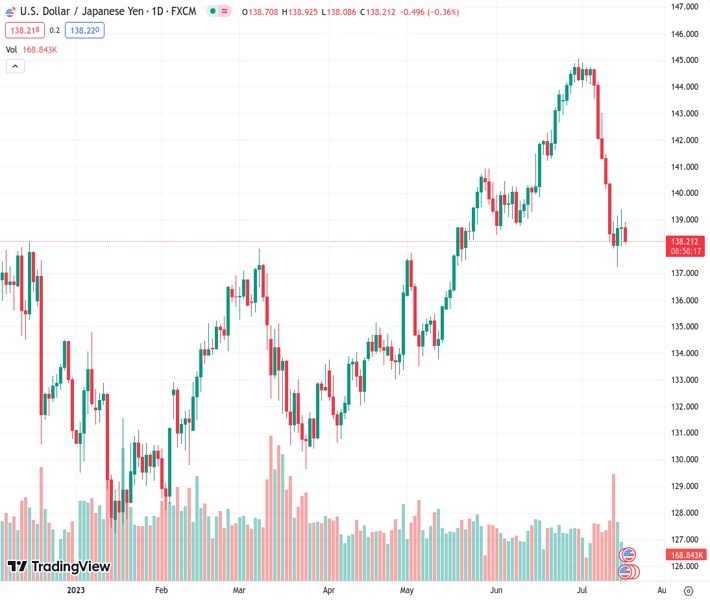
The exchange rate of USDJPY, which was previously at 138.259, has fallen close to 138.00 due to an unclear situation with the US Dollar Index as retail figures approach.
…
This is a premium post.
[s2If !current_user_can(access_s2member_level4)]Please register for FREE REGISTER to read full post below containing analysis. In case of any error or you think you are not able to read the full post below, please email us at support#nehcap.com [lwa][/s2If] [s2If current_user_can(access_s2member_level1)]
- USD/JPY has retreated to near 138.00 amid uncertainty in the US Dollar Index ahead of retail figures.
The pair currently trades last at 138.259.
The previous day high was 139.41 while the previous day low was 138.0. The daily 38.2% Fib levels comes at 138.54, expected to provide resistance. Similarly, the daily 61.8% fib level is at 138.87, expected to provide resistance.
The USD/JPY pair has dropped back to near the crucial support of 138.00 in the European session. The asset is struggling to find any direction as the US Dollar Index (DXY) is showing uncertain moves. Sheer volatility in the US Dollar Index would recede and the asset might get a direction after the release of the United States Retail Sales data.
S&P500 futures have generated nominal losses in London, portraying a quiet market mood. US equities could face some heat as firms are reporting quarterly results, therefore, a stock-specific action will be observed.
The US Dollar Index (DXY) is demonstrating signs of a volatility squeeze after finding buying interest post-testing its annual low of around 99.60. Meanwhile, the 10-year US Treasury yields have dropped to near 3.76%.
Investors are keenly awaiting the release of the US Retail Sales data for further guidance. Analysts at RBC Economics expect that US Retail Sales will likely tick up 0.6% in June, thanks to a boost in auto sales during that month. We expect ex-auto sales were little changed at +0.1% on a monthly basis, supported by a price-related increase in gasoline station sales.
Regarding interest rate guidance, investors are expecting that the Federal Reserve (Fed) will find a peak in interest rates more quickly than other global central banks. As per the CME Fedwatch tool, investors are more confident about only one interest rate hike from the Fed by year-end.
On the Japanese Yen front, investors have shifted their focus toward the interest rate decision by the Bank of Japan (BoJ), which will be announced next week. BoJ Governor Kazuo Ueda is expected to maintain a dovish policy stance to maintain inflation steadily around 2%.
Technical Levels: Supports and Resistances
USDJPY currently trading at 138.39 at the time of writing. Pair opened at 138.72 and is trading with a change of -0.24 % .
| Overview | Overview.1 | |
|---|---|---|
| 0 | Today last price | 138.39 |
| 1 | Today Daily Change | -0.33 |
| 2 | Today Daily Change % | -0.24 |
| 3 | Today daily open | 138.72 |
The pair is trading below its 20 Daily moving average @ 142.35, below its 50 Daily moving average @ 140.22 , above its 100 Daily moving average @ 137.04 and above its 200 Daily moving average @ 137.05
| Trends | Trends.1 | |
|---|---|---|
| 0 | Daily SMA20 | 142.35 |
| 1 | Daily SMA50 | 140.22 |
| 2 | Daily SMA100 | 137.04 |
| 3 | Daily SMA200 | 137.05 |
The previous day high was 139.41 while the previous day low was 138.0. The daily 38.2% Fib levels comes at 138.54, expected to provide resistance. Similarly, the daily 61.8% fib level is at 138.87, expected to provide resistance.
Note the levels of interest below:
- Pivot support is noted at 138.0, 137.29, 136.59
- Pivot resistance is noted at 139.42, 140.12, 140.83
| Levels | Levels.1 |
|---|---|
| Previous Daily High | 139.41 |
| Previous Daily Low | 138.00 |
| Previous Weekly High | 143.00 |
| Previous Weekly Low | 137.24 |
| Previous Monthly High | 145.07 |
| Previous Monthly Low | 138.43 |
| Daily Fibonacci 38.2% | 138.54 |
| Daily Fibonacci 61.8% | 138.87 |
| Daily Pivot Point S1 | 138.00 |
| Daily Pivot Point S2 | 137.29 |
| Daily Pivot Point S3 | 136.59 |
| Daily Pivot Point R1 | 139.42 |
| Daily Pivot Point R2 | 140.12 |
| Daily Pivot Point R3 | 140.83 |
[/s2If]
Download Nehcap EAWe have two EAs that are operational on our LIVE accounts.
- EA-FIX: Check out the details here. Download EA-FIX . EA-FIX is a non-grid HFT scalper.
- EA-GROWTH: High quality low dd EA using trend grids. Download EA_GROWTHJoin Our Telegram Group
")


